Statistics for Economics Class 11 NCERT Solutions Chapter 3 Organisation of Data
Question 1.
Which of the following alternatives is true?
(i) The class mid-point is equal to
(a) the average of the upper class limit and the lower class limit
(b) the product of upper class limit and the lower class limit
(c) the ratio of the upper class limit and the lower class limit
(d) None of the above
Answer:
(a) The class mid-point is the middle value of a class. It lies halfway between the lower class limit and the upper class limit of a class and is calculated as
Class Mid-Point or Class Mark = \(\frac{\text { (Upper Class Limit + Lower Class Limit) }}{2}\)
(ii) The frequency distribution of two variables is known as
(a) Univariate Distribution
(b) Bivariate Distribution
(c) Multivariate Distribution
(d) None of the above
Answer:
(b) Bi means two and hence the frequency distribution of two variables is known as Bivariate Distribution.
(iii) Statistical calculation in classified data are based on
(a) the actual values of observations
(b) the upper class limits
(c) the lower class limits
(d) the class mid-points
Answer:
(d) The class mid-points of each class is used to represent the class and therefore, it is used in further calculations after the raw data are grouped into classes.
(iv) Under exclusive method,
(a) the upper class limit of a class is excluded in the class interval
(b) the upper class limit of a class is included in the class interval
(c) the lower class limit of a class is excluded in the class interval
(d) the lower class limit of a class is included in the class interval
Answer:
(a) Under the exclusive method we form classes in such a way that the lower limit of a class coincides with the upper class limit of the previous class. Under the method, the upper class limit is excluded but the lower class limit of a class is included in the interval.
(v) Range is the
(a) difference between the largest and the smallest observations
(b) difference between the smallest and the largest observations
(c) average of the largest and the smallest observations
(d) ratio of the largest to the smallest observation
Answer:
(a) The variation in variable’s value are captured by its range. The range is the difference between the largest and the smallest values of the variable. A large range indicates that the values of the variable are widely spead.
Question 2.
Can there be any advantage in classifying things? Explain with an example from your daily life.
Answer:
Classification refers to arranging or organising similar things into groups or classes. Classification of objects or things saves our valuable time and effort. Classification is done to group things in such a way that each group consists of similar items, e.g., we classify our wardrobe into different types of clothes or dresses according to the occasions on which they are to be worn. We put party wears, school uniform, casual daily wears and night wears separately. This helps us in an orderly arrangement of clothes and we can easily fetch the clothes we want at a particular time without searching through the whole wardrobe. Thus, it is evident that classification saves time and labour and helps to produce the desired results.
Question 3.
What is a variable? Distinguish between a discrete and a continuous variable.
Answer:
A measurable characteristic which takes different values at different points of time and in different circumstance is called a variable as it keeps varying. Different varibles vary differently and depending on the way they vary, they are broadly classified into two types
| S.N. | Discrete Variable | Continuous Variable |
| (i) | A discrete variable can take only whole numbers. | A continuous variable can take any numerical value. |
| (ii) | Discrete varibles increase in finite jumps from one value to another and cannot take any intermediate value between them. | Continuous variables can take any conceivable value and can be broken into infinite gradations. |
| (iii) | Examples-number of workers in a factory, number of residents in a colony, etc. | Examples-height, weight, distance, etc. |
Question 4.
Explain the ‘exclusive’ and ‘inclusive’ methods used in classification of data.
Answer:
Exclusive Method In this method, the classes are formed in such a way that the upper class limit of one class becomes the lower class limit of the next class. Continuity of the data is maintained in this method. Under this method, the upper class limit is excluded but the lower class limit of a class is included in the interval.
According to this method, an observation that is exactly equal to the upper class limit would not be included in that class but would be included in the next class. On the other hand, if it were equal to the lower class limit then it would be included in that class, e.g., if the class intervals are 0-5, 5-10, 15¬20 and so on, a value of 10 would be included in the 10-15 and not in the interval 5-10.
Inclusive Method The inclusive method does not exclude the upper class limit in a class interval. It inlcludes the upper class in a class. Thus, both class limits are parts of the class interval, e.g., the class intervals of 0-5, 6-10, 11-15, and so on are inclusive.
Question 5.
Use the data in Table 3.2 that relate to monthly household expenditure (in ₹) on food of 50 households and
(i) Obtain the range of monthly household expenditure on food.
(ii) Divide the range into appropriate number of class intervals and obtain the frequency distribution of expenditure.
(iii) Find the number of households whose monthly expenditure on food is
- less than ₹ 2,000
- more than ₹ 3,000
- between ₹ 1,500 and ₹ 2,500
Answer:
(i) Range = Largest Value – Smallest Value
Highest Value = 5090
Lowest Value = 1007
So, Range = 5090 – 1007 = 4083
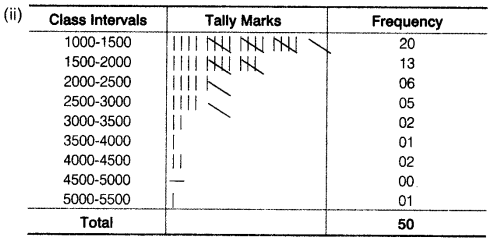
(iii) (a) Number of households whose monthly expenditure on food is less than ₹ 2000
= 20 + 13 = 33
(b) Number of hoseholds whose monthly expenditure on food is more than ₹ 3000
= 2 + 1 + 2 + 0 + 1 = 6
(c) Number of households whose expenditure on food is between ₹ 1500 and ₹ 2500
= 13 + 6= 19
Question 6.
In a city, 45 families were surveyed for the number of domestic appliances they used. Prepare a frequency array based on their replies as recorded below.
1 3 2 2 2 2 1 2 1 2 2 3 3 3 3
3 3 2 3 2 2 6 1 6 2 1 5 1 5 3
2 4 2 7 4 2 4 3 4 2 0 3 1 4 3
Answer:
| No. of Domestic Appliances | No. of Households |
| 0 | 1 |
| 1 | 7 |
| 2 | 15 |
| 3 | 12 |
| 4 | 5 |
| 5 | 2 |
| 6 | 2 |
| 7 | 1 |
| Total | 45 |
Question 7.
What is loss of information’ in classified data?
Answer:
Classification of data as a frequency distribution summarises the raw data making it concise and comprehensible but it does not show the details that are found in raw data. Once, the data are grouped into classes, an individual observation has no significance in further statistical calculations.
All values in a class interval are assumed to be equal to the middle value of the class interval instead of their actual value which causes considerable loss of information. It not only save our time but also our energy, which would otherwise be utilised in searching from entire things.
Question 8.
Do you agree that classified data is better than raw data?
Answer:
The raw data is usually large and fragmented and it is very difficult to draw any meaningful conclusion from them. Classification makes the raw data comprehensible by summarising them into groups. When facts of similar characteristics are placed in the same class, it enables one to locate them easily, analyse them, make comparison and draw inferences.
Question 9.
Distinguish between univariate and bivariate frequency distribution.
Answer:
The term “uni” stands for one and thus the frequency distribution of a single variable is called a Univariate Distribution, e.g., the fequency distribution of age of students in a class is univariate as its gives the distribution of a single variable i.e., age. On the other hand “bi” means two and a Bivariate Frequency Distribution is the frequency distribution of two variables, e.g., the frequency distribution of two varibles, e.g., like price of good and sales of the good is a bivariate distribution.
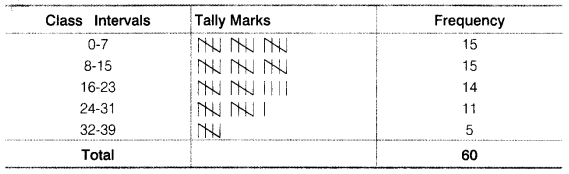
Question 10.
Prepare a frequency distribution by inclusive method taking class interval of 7 from the following data
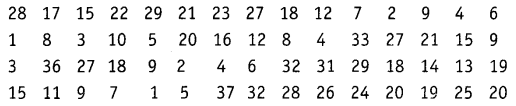
Answer: