Extra Questions for Class 10 Maths Statistics with Answers
Extra Questions for Class 10 Maths Chapter 14 Statistics. According to new CBSE Exam Pattern, MCQ Questions for Class 10 Maths Carries 20 Marks.
You can also download Class 10 Maths NCERT Solutions to help you to revise complete syllabus and score more marks in your examinations.
Statistics Class 10 Extra Questions Very Short Answer Type
Question 1.
Find the median of arranged series of an even number of n terms.
Answer:
We know that if n = Even
then Median = \(\frac{(n)^{t h} \text { term }+(n+1)^{t h} \text { term }}{2}\)
Question 2.
Find the median class of the following data:
| Marks obtained | Frequency |
| 0-10 | 8 |
| 10-20 | 10 |
| 20-30 | 12 |
| 30-40 | 22 |
| 40-50 | 30 |
| 50-60 | 18 |
Answer:
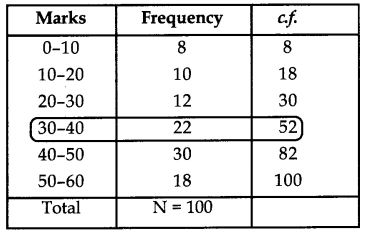
∴ \(\frac{\mathrm{N}}{2}=\frac{100}{2}\) = 50
Looking in the table c.f. just greater than 50 is 52.
∴ Median class = Class corresponding to 52 = 30 – 40.
Question 3.
Find the class marks of classes 10-25 and 35-55.
Answer:
Class mark of 10-25 = \(\frac{10+25}{2}=\frac{35}{2}\) = 17.5
Class mark of 35-55 = \(\frac{35+55}{2}=\frac{90}{2}\) = 45
Question 4.
The point of intersection of two ogives for a distribution is given by (23.7,40.5). What is the median?
Answer:
x-coordination of point of intersection of two ogives give 23.7.
∴ Median = 23.7
Question 5.
If mode = 400 and median = 500, find mean.
Answer:
Mean = Mode + \(\frac{3}{2}\) (Median – Mode)
= 400 + \(\frac{3}{2}\) (500 – 400)
= 400 + 150
= 550
Question 6.
What is the modal class of the following distribution?
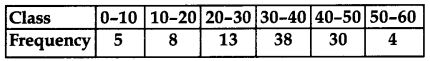
Answer:
The highest frequecny 38 corresponds to 30-40.
∴ The modal class is 30-40.
Question 7.
If the mode of the following data is 7, then find the value of k.
2, 4, 6, 7, 5, 6, 10, 6, 7, 2k + 1, 9, 7, 13
Answer:
There are two entries which occur 3 times each which are 6 and 7.
For 7 to be mode
2k + 1 = 7
k = \(\frac{6}{2}\) = 3
Question 8.
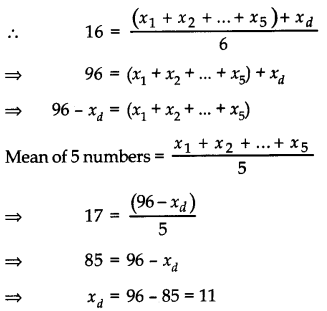
The mean of 6 numbers is 16 with the removal of a number the mean of remaining numbers is 17. Find the removed number.
Answer:
Let xd be the sixth number to be remove and x1 x2, …,x5 be remaining 5 numbers.
Statistics Class 10 Extra Questions Short Answer Type-1
Question 1.
Age of pumps manufactured by a company are given in the following distribution table.
| Age (in years) | No. of Pumps |
| 0-1 | 12 |
| 1-2 | 18 |
| 2-3 | 45 |
| 3-4 | 23 |
| 4-5 | 12 |
| 5-6 | 08 |
| 6-7 | 04 |
Calculate the modal age of pumps. [CBSE 2016]
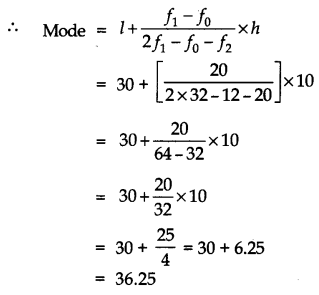
Answer:
Maximum frequency is 45 and it corresponds to the class interval 2-3
∴ Modal class = 2 – 3
So, l = 2; fi = 45; f0 = 18, f2 = 23 and h = 1
Question 2.
The mean of following frequency distribution is 70. Find the missing frequency x.
| CL | Frequency |
| 0-20 | 5 |
| 20-40 | 8 |
| 40-60 | 21 |
| 60-80 | 12 |
| 80-100 | x |
| 100-120 | 8 |
Answer:
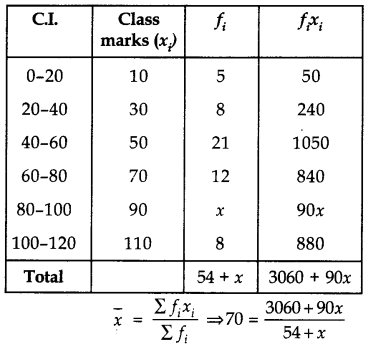
⇒ 3780 + 70x = 3060 + 90x
⇒ 720 = 20x
⇒ x = \(\frac{720}{20}\) = 36
Question 3.
The mean of 11 numbers is 35. If mean of first 6 numbers is 32 and that of last 6 numbers is 37, find 6th number.
Answer:
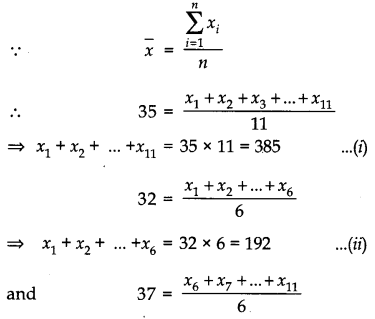
⇒ x6 + x7 + ……… + x11 = 37 × 6 = 222 ………..(iii)
(ii) and (iii)
⇒ (x1 + x2 + …….. + x6) + (x6 + …….. + x11) = 192 + 222
⇒ x6 + (x1 + x2 + ………. + x11) = 414
⇒ x6 + 385 = 414
⇒ x6 = 414 – 385 = 29 (∵ of (i))
Question 4.
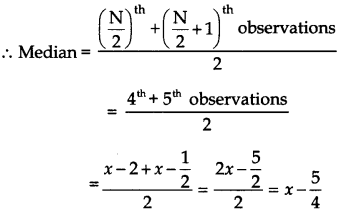
If a variable x takes discrete value x + 4, x – \(\frac{7}{2}\), x – \(\frac{5}{2}\), x – 2, x + \(\frac{1}{2}\), x + 5, x – 3, x – \(\frac{1}{2}\), find its median.
Answer:
Arranging the data in ascending order
x – \(\frac{7}{2}\), x – 3, x – \(\frac{5}{2}\), x – 2, x – \(\frac{1}{2}\), x + \(\frac{1}{2}\), x + 4, x + 5
Here, N = 8 (even)
Question 5.
Find the mode of the following data:
| Height (in cm) | No. of toys |
| 0-10 | 6 |
| 10-20 | 10 |
| 20-30 | 12 |
| 30-40 | 32 |
| 40-50 | 20 |
Answer:
Modal class = 30 – 40
l = 30
f1 = 32, f0 = 12, f2 = 20
Question 6.
Find median of the following data:
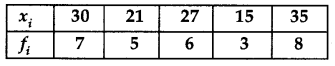
Answer:
Here data is not in ascending order so we first arrange it in ascending order and then append a cumulative frequency column.
| xi | fi | cf |
| 15 | 3 | 3 |
| 21 | 5 | 8 |
| 27 | 6 | 14 |
| 30 | 7 | 21 |
| 35 | 8 | 29 |
| N = 29 |
Here N = 29, which is odd
∴ Medium = \(\left(\frac{N+1}{2}\right)^{\text {th }}\) observation
= \(\left(\frac{29+1}{2}\right)^{\text {th }}\) = 15th observation
Since, 15th observation lie in the cumulative frequency 21 for which corresponding observation is 30.
∴ Median = 30
Question 7.
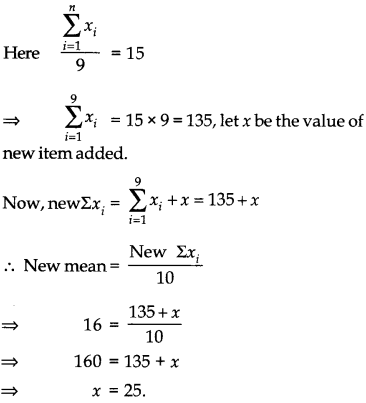
The mean of 9 items is 15. If one more item is added to this series, the mean becomes 16. Find the value of the 10th item.
Answer:
Question 8.
In a school 85 boys and 35 girls appeared in a public examination. The mean marks of boys was found to be 40% whereas the mean marks of girls was 60%. Determine the average marks percentage of the school.
Answer:
Assuming the maximum marks to be 100.
Mean marks of boys (XB ) = 40
and mean marks of girls (XG ) = 60
Also no. of boys (nB) = 85
and no. of girls (nG) = 35
Question 9.
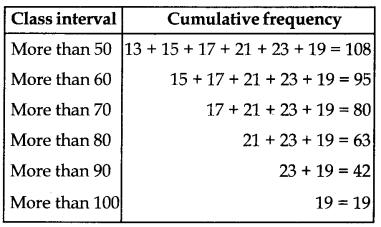
Construct a more than cumulative frequency distribution table for the given data:
| Class interval | Frequency |
| 50-60 | 13 |
| 60-70 | 15 |
| 70-80 | 17 |
| 80-90 | 21 |
| 90-100 | 23 |
| 100-110 | 19 |
Answer:
Question 10.
Find the median of following given data:
| X | f |
| 6 | 9 |
| 7 | 12 |
| 5 | 8 |
| 2 | 13 |
| 10 | 11 |
| 9 | 14 |
| 3 | 7 |
Answer:
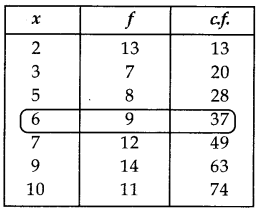
\(\frac{N}{2}=\frac{74}{2}\) = 37
⇒ Median = 6.
Question 11.
Write a frequency distribution table for the following data:
| Marks | No. of student |
| Above 0 | 30 |
| Above 10 | 28 |
| Above 20 | 21 |
| Above 30 | 15 |
| Above 40 | 10 |
| Above 50 | 0 |
Answer:
| Marks | No. of students |
| 0-10 | 30 – 28 = 2 |
| 10-20 | 28 – 21 = 7 |
| 20-30 | 21 – 15 = 6 |
| 30-40 | 15 – 10 = 5 |
| 40-50 | 10-0 = 10 |
| Total | 30 |
Question 12.
The length of 42 leaves of a plant are measured correct up to nearest millimetre and the data is as under:
| Length (in mm) | Number of leaves |
| 118-126 | 4 |
| 126-134 | 5 |
| 134-142 | 10 |
| 142-150 | 14 |
| 150-158 | 4 |
| 158-166 | 5 |
Find the modal length of a leave.
Answer:
Since, the maximum number of leaves is 14, therefore modal class 142-150, l = 142, h = 8, f1 = 14, f0 = 10, f2 = 4
Mode = l + \(\frac{f_1-f_0}{2 f_1-f_0-f_2}\) × h
= 142 + \(\frac{14-10}{2 \times 14-10-4}\) × 8
= 142 + \(\frac{4}{14}\) × 8 = 144.29
Question 13.
Find the mean of the following frequency distributions by the direct method:
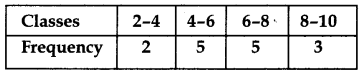
Answer:
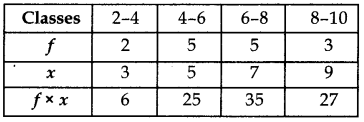
Σf × x = 93, Σf = 15
Mean = \(\frac{\Sigma f x}{\Sigma f}=\frac{93}{15}\) = 6.2
Statistics Class 10 Extra Questions Short Answer Type-2
Question 1.
For Uttarakhand flood victims, money donated by teachers of a school is shown in the following frequency distribution:
| Money donated (in ₹) | No. of Teachers |
| 500-700 | 4 |
| 700-900 | 3 |
| 900-1100 | 18 |
| 1100-1300 | 2 |
| 1300-1500 | 3 |
Find mean and median for this data. [CBSE Delhi 2016]
Answer:
Mean:
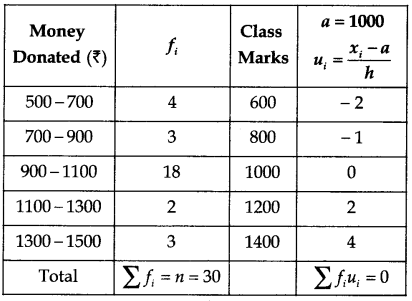
From the above data, Assumed mean (a) = 1000
Width of the class (h) = 200
∴ ū = \(\frac{\sum f_i u_i}{\sum f_i}=\frac{0}{30}\) = 0
Mean (x̄) = a + hū
= 1000 + 100 × 0
= 1000
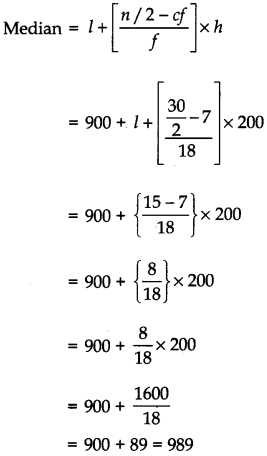
Median
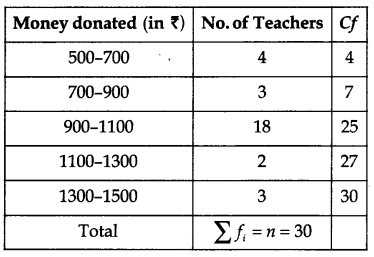
Here, Σfi = n = 30, then \(\frac{n}{2}=\frac{30}{2}\) =15
which lies in interval 900 – 1100.
Median class = 900 – 1100
l = 900, n = 30, f = 18, cf = 7 and h = 200
Question 2.
The table below shows the salaries of 280 persons:
| Salary (In thousand ₹) | No. of Persons |
| 5-10 | 49 |
| 10 – 15 | 133 |
| 15 – 20 | 63 |
| 20 – 25 | 15 |
| 25 – 30 | 6 |
| 30 – 35 | 7 |
| 35 – 40 | 4 |
| 40 – 45 | 2 |
| 45-50 | 1 |
Calculate the median salary of the data.
Answer:
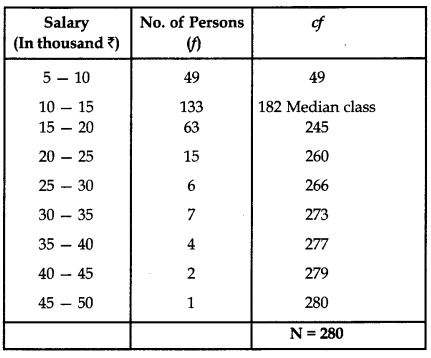
\(\frac{\mathrm{N}}{2}=\frac{280}{2}\) = 140
Median class is 10 – 15
Median = l + \(\frac{h}{f}\left(\frac{\mathrm{N}}{2}-C\right)\)
= 10 + \(\frac{5}{133}\)(140 – 49)
= 10 + \(\frac{5 \times 91}{133}\) = 13.42
Median salary is ₹ 13.42 thousand or ₹ 13420 (approx).
Question 3.
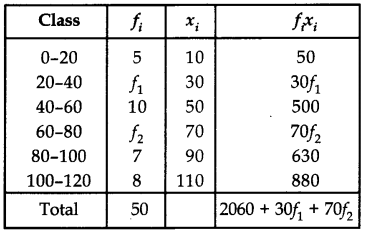
The mean of the following frequency distribution is 62.8 and the sum of all frequencies is 50. Compute the missing frequencies f1 and f2.
| Class | Frequency |
| 0-20 | 5 |
| 20-40 | A |
| 40-60 | 10 |
| 60-80 | A |
| 80-100 | 7 |
| 100-120 | 8 |
| Total | 50 |
Answer:
Now 50 = 5 + f1 + 10 + f2 + 7 + 8
⇒ 50 = 30 + f1 + f2
⇒ f1 + f2 = 20 ……….(i)
Also, Mean = \(\frac{\Sigma f_i x_i}{\Sigma f_i}\)
⇒ 62.8 = \(\frac{2060+30 f_1+70 f_2}{50}\)
3140 = 2060 + 30f1 + 70f2
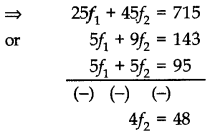
3f1 + 7f2 = 108
Solving (i) and (ii), we get
f1 = 8 and f2 = 12
Question 4.
Find the missing frequecny (x) of the following data if its mode is ₹240.
Answer:
Here mode is given to be ₹ 240, which lies between 200 and 300. Therefore, modal class is 200 – 300
We have l = 200, f1 = 270, f0 = 230, f2 = x
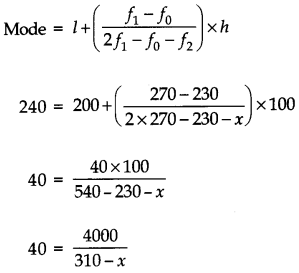
12400 – 40x = 4000
40x = 12400 – 4000
40x = 8400
x = 210
Question 5.
Find the missing frequency f1 and f2 if mean of 50 observations is 38.2.
| Class interval | Frequency |
| 0-10 | 4 |
| 10-20 | 4 |
| 20-30 | f1 |
| 30-40 | 10 |
| 40-50 | f2 |
| 50-60 | 8 |
| 60-70 | 5 |
Answer:
| Class interval | Frequency fi | xi | fixi |
| 0-10 | 4 | 5 | 20 |
| 10-20 | 4 | 15 | 60 |
| 20-30 | f1 | 25 | 25f1 |
| 30-40 | 10 | 35 | 350 |
| 40-50 | f2 | 45 | 45f2 |
| 50-60 | 8 | 55 | 440 |
| 60-70 | 5 | 65 | 325 |
| Total | 50 | 1195 + 25f1 + 45f2 |
Σfi = 31 + f1 + f2
31 + f1 + f2
f1 + f2 = 19 ………..(i)
38.2 = \(\frac{1195+25 f_1+45 f_2}{50}\)
⇒ f2 = 12
Putting f2 = 12 in (i)
⇒ f1 = 7
Question 6.
Find the mean of the following frequency distribution by short cut method:
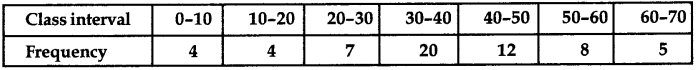
Answer:
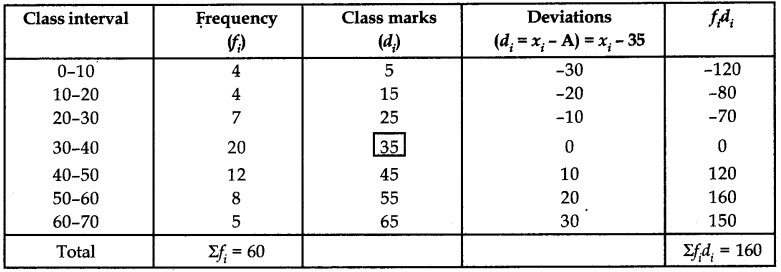
Let assumed mean (A) be 35.
∴ Mean (x̄) = A + \(\frac{\Sigma f_i d_i}{\Sigma f_i}\) = 35 + \(\frac{160}{60}\)
= 35 + 2.67
= 37.67
Question 7.
Form a grouped frequency distribution and calculate the median.
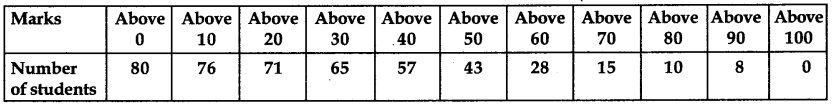
Answer:
We first convert the given data into grouped frequency distribution and then append a cumulative frequency column as given below.
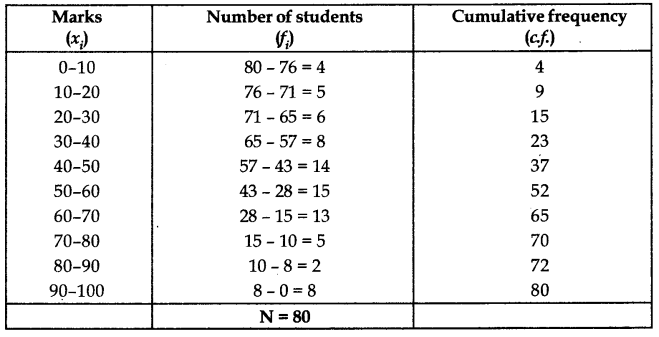
Here N = 80 ⇒ \(\frac{\mathrm{N}}{2}=\frac{80}{2}\) = 40
Cumulative frequency just greater than or equal to 40 is 52 which corresponds to 50 – 60.
Median class = 50-60
The lower limit of the median class (l) – 50
The cumulative frequency of the class preceding the median class (cf) = 37
The frequency of the median class (50 – 60) (f) = 15
The width of the median class (h) = 10
∴ Median = l + \(\frac{\left(\frac{\mathrm{N}}{2}-c f\right)}{f}\) × h
= 50 + \(\left(\frac{40-37}{15}\right)\) × 10
= 50 + \(\frac{30}{15}\) = 50 + 2 = 52
Question 8.
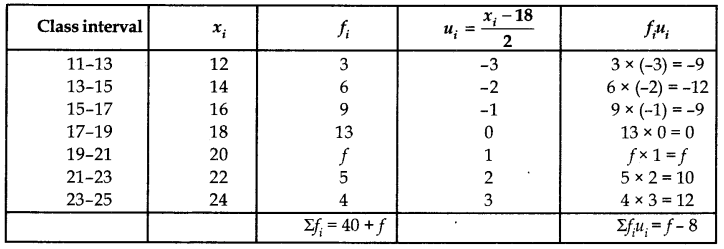
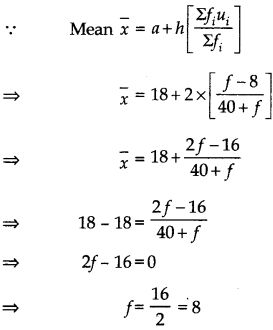
The mean of the following distribution is 18. [CBSE 2018]

Answer:
Let the assumed mean (a) = 18
∵ h = 2
∴ ui = \(\frac{x_i-18}{2}\)
∴ We have the following table:
Question 9.
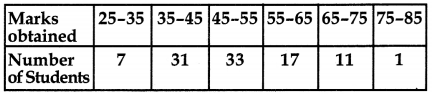
Find the mode of the following distribution of marks obtained by the students in an examination:
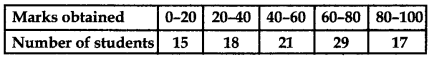
Given the mean of the above distribution is 53, using emperical relationship estimate the value of its median.
Answer:
Sol. Modal class is 60-80 (Class corresponding to maximum frequency)
∴ Mode = l + \(\left(\frac{f_1-f_0}{2 f_1-f_0-f_2}\right)\) × h
= 60 + \(\left(\frac{29-21}{58-21-17}\right)\) × 20 = 68
So, the mode marks is 68.
Empirical relationship between the three measures of central tendencies is:
3 Median = Mode + 2 mean
3 Median = 68 + 2 × 53
Median = 58 marks
Statistics Class 10 Extra Questions Long Answer Type 1
Question 1.
If the median of the following frequency distribution is 32.5. Find the values of f1 and f2. [CBSE 2019]

Or
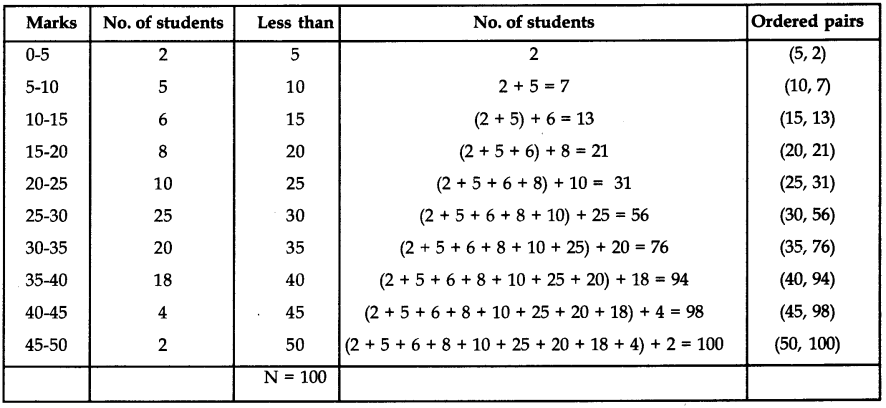
The marks obtained by 100 students of a class in an examination are given below.
| Marks | No. of Students |
| 0-5 | 2 |
| 5-10 | 5 |
| 10-15 | 6 |
| 15-20 | 8 |
| 20-25 | 10 |
| 25-30 | 25 |
| 30-35 | 20 |
| 35-40 | 18 |
| 40-45 | 4 |
| 45-50 | 2 |
Draw ‘a less than’ type cumulative frequency curves (Ogive). Hence find median.
Answer:
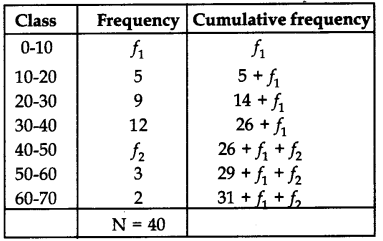
Median = 32.5
∴ Median class is 30-40
Median = \(\frac{l+\left(\frac{\mathrm{N}}{2}-\mathrm{C}\right)}{f}\) × h
Here, l = 30, N = 40, C = 14 + f1
f1 = 12, h = 10
∴ 32.5 = 30 + \(\frac{10}{12}\)(20 – 14 – f1)
⇒ f1 = 3
Also, 31 + f1 + f2 = 40
Putting f1 = 3 in (2)
⇒ f2 = 6
Or
Next we plot the points of last column
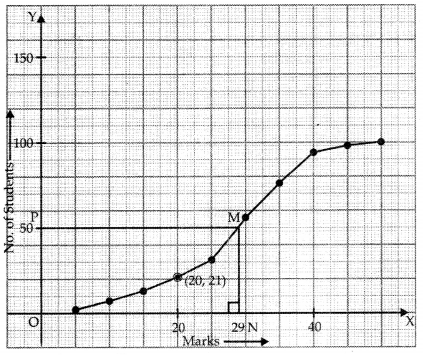
Mark point ‘F corresponding to \(\frac{N}{2}\) = 50.
Draw PM ∥ x-axis to cut Ogive at M.
Draw MN ⊥ x-axis to cut it at N.
Since, N is (29, 0)
∴ Median = 29.
Question 2.
If the mean of the following frequency distribution is 62.8, then find the missing frequency x: [CBSE 2019(C)]
| Class | Frequency |
| 0-20 | 5 |
| 20-40 | 8 |
| 40-60 | X |
| 60-80 | 12 |
| 80-100 | 7 |
| 100-120 | 8 |
Answer:
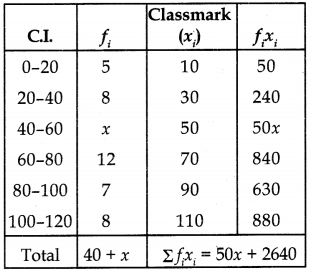
Now, mean (x̄) = \(\frac{\sum f_i x_i}{\sum f_i}\)
62.8 = \(\frac{(50 x+2640)}{40+x}\)
⇒ 62.8 (40 + x) = 50x + 2640
⇒ 2512 + 62.8x = 50x + 2640
⇒ 12.8x = 128
⇒ x = \(\frac{128}{12.8}\) = 10
Question 3.
Find the mean, mode and median of the following data:
| Classes | Frequency (f) |
| 0-10 | 3 |
| 10-20 | 8 |
| 20-30 | 10 |
| 30-40 | 15 |
| 40-50 | 7 |
| 50-60 | 4 |
| 60-70 | 3 |
Answer:
We prepare the table which serves all three purposes of getting mean, median and mode as given below:
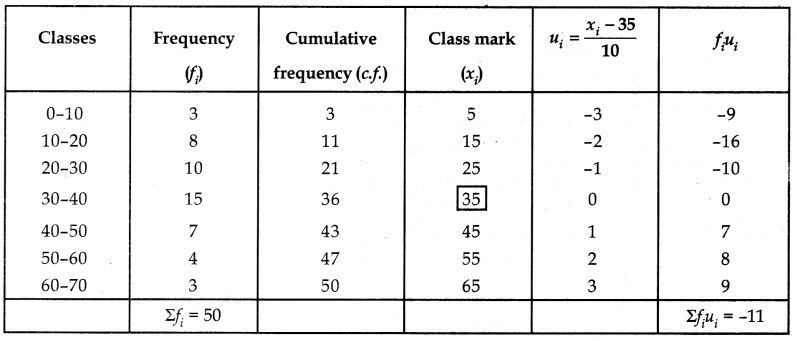
(i) Mean: Let assumed mean (A) be 35.
Mean = A + \(\left(\frac{\Sigma f_i u_i}{\Sigma f_i} \times h\right)\)
= 35 + \(\left(\frac{-11}{50} \times 10\right)\)
= 35 – 2.2 = 32.8
(ii) Mode: As maximum frequency is 15.
∴ Mode classes is 30-40.
Thus f1 = 15, f0 = 10 , f2 = 7
Mode = l + \(\left(\frac{f_1-f_0}{2 f_1-f_0-f_2}\right)\) × h
= 30 + \(\left(\frac{15-10}{30-10-7}\right)\) × 10
= 30 + \(\frac{50}{13}\) = 30 + 3.85 = 33.85
(iii) Median: Here N = 50 ⇒ \(\frac{N}{2}\) = 25
The cumulative frequency just greater than 25 is 36 and the corresponding class is 30-40.
∴ Median class = 30-40, l = 30, cf = 21, f = 15
Now, Median = l + \(\left(\frac{\frac{\mathrm{N}}{2}-c f}{f}\right)\) × h
= 30 + \(\left(\frac{25-21}{15}\right)\) × 10
= 30 + \(\frac{40}{15}\) = 30 + 2.67 = 32.67
Question 4.
During the medical check up of 35 students of a class, their weights were recorded as follows:
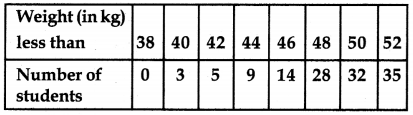
Draw a less than type ogive for the given data. Hence obtain the median weight from the graph and verify by using the formula.
Answer:
Here data is already tabulated as less than cumulative frequency table.
So, we have to just plot the ordered pairs (38,0), (40,3), (42,5), (44,9), (46,14), (48,28), (50,32) and (52,35) join them by free hand to get the less than type ogive as shown below:
Here \(\frac{\mathrm{N}}{2}=\frac{35}{2}\) = 17.5. So we mark a point R on y-axis such that OR = 17.5
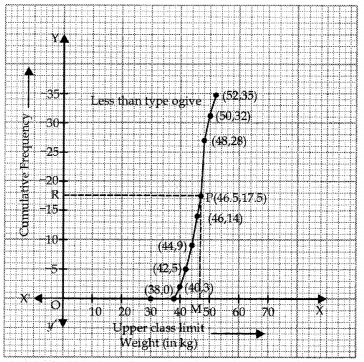
Draw a line RP parallel to x-axis as shown in graph which meets the ogive at point P.
Draw PM ⊥ OX
Now Since OM = 46.5
∴ Median = 46.5
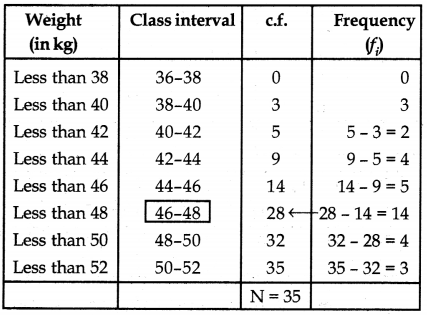
Verification: For calculation median by using formula we first convert the given cumulative frequency table to continuous grouped frequency distribution as given below:
Question 5.
Draw ‘Less than’ and ‘more than’ ogives for the following distribution and hence find its median.
| Class | Frequency |
| 20-30 | 8 |
| 30-40 | 12 |
| 40-50 | 24 |
| 50-60 | 6 |
| 60-70 | 10 |
| 70-80 | 15 |
| 80-90 | 25 |
Answer:
| ‘Less than ogive’ | ||
| ‘Less than’ | c.f | Ordered pairs |
| 20 | 0 | (20, 0) |
| 30 | 8 | (30, 8) |
| 40 | 20 | (40, 20) |
| 50 | 44 | (50, 44) |
| 60 | 50 | (60, 50) |
| 70 | 60 | (70, 60) |
| 80 | 75 | (80, 75) |
| 90 | 100 | (90,100) |
| ‘More than ogive’ | ||
| ‘More than’ | c.f | Ordered pairs |
| 20 | 100 | (20,100) |
| 30 | 92 | (30, 92) |
| 40 | 80 | (40, 80) |
| 50 | 56 | (50, 56) |
| 60 | 50 | (60,50) |
| 70 | 40 | (70,40) |
| 80 | 25 | (80, 25) |
| 90 | 0 | (90,0) |
The ‘less than’ type and ‘more than’ type ogives can be drawn on graph paper as:
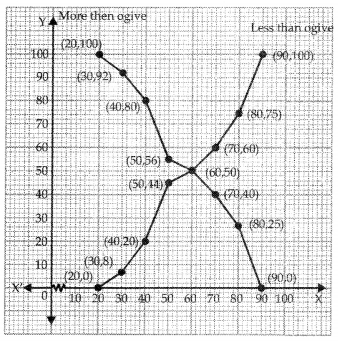
It can be observed that the ‘less than’ type and ‘more than’ type ogives of the given frequency distribution intersect at point P(60, 50). If we draw a perpendicular to the x-axis from point P, then the value on the x-axis is obtained as 60.
Thus, the median of the given data is 60.
Question 6.
Calculate the mode of the following frequency distribution table:
| Marks | Number of students |
| Above 25 | 52 |
| Above 35 | 47 |
| Above 45 | 37 |
| Above 55 | 17 |
| Above 65 | 8 |
| Above 75 | 2 |
| Above 85 | 0 |
Answer:
| CL | f | c.f |
| 25-35 | 5 | 52 |
| 35-45 | 10 | 47 |
| 45-55 | 20 | 37 |
| 55-65 | 9 | 17 |
| 65-75 | 6 | 8 |
| 75-85 | 2 | 2 |
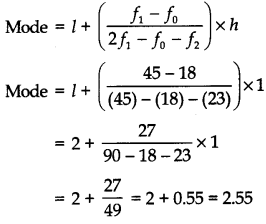
∴ Mode = l + \(\left[\frac{f_1-f_0}{2 f_1-f_0-f_2}\right]\) × h
= 45 + \(\frac{(20-10)}{2 \times 20-10-9}\) × 10
= 45 + \(\frac{100}{21}\)
= 49.76
Question 7.
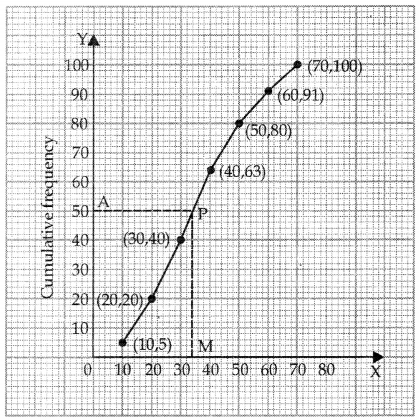
The following table shows the ages of 100 persons of a locality. Draw less than ogive.
| Age (in years) | Number of persons |
| 0-10 | 5 |
| 10-20 | 15 |
| 20-30 | 20 |
| 30-40 | 23 |
| 40-50 | 17 |
| 50-60 | 11 |
| 60-70 | 9 |
Answer:
| Age (in years) | No. of persons | Ordered pairs |
| Less than 10 | 5 | (10,5) |
| Less than 20 | 20 | (20, 20) |
| Less than 30 | 40 | (30,40) |
| Less than 40 | 63 | (40, 63) |
| Less than 50 | 80 | (50, 80) |
| Less than 60 | 91 | (60, 91) |
| Less than 70 | 100 | (70,100) |
At A(Corresponding to \(\frac{N}{2}\) = 50) draw AP ∥x-axis
From P draw PM ⊥x -axis. Abscissa of M is 34.5(approx)
∴ Median = 34.5 (Approx)
Question 8.
Find the mode, median and mean for the following data:
Answer:
Let the assumed mean a = 60. Here h = 10, we have:
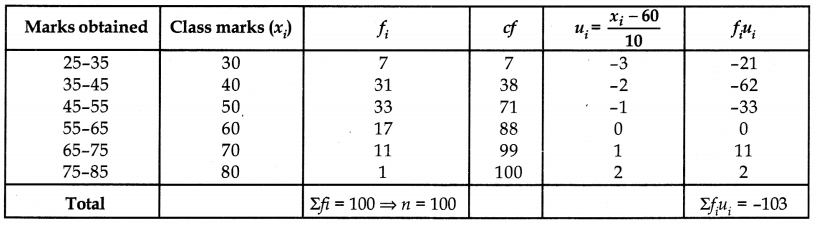
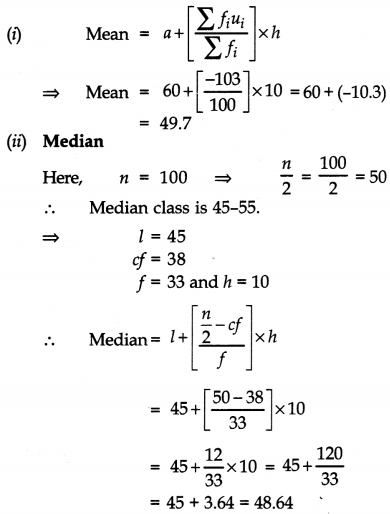
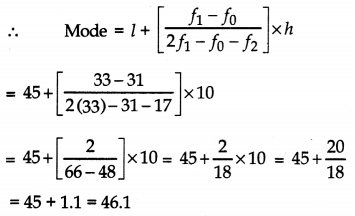
(iii) Mode: Greatest frequency is 33 which corresponds to the class 45-55.
l1 = 45, h = 10
f1 = 33, f2 = 17
f0 = 31
Question 9.
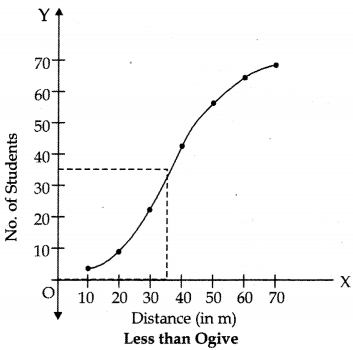
The following frequency distribution shows the distance (in metress) thrown by 68 students in a Javelin throw competition.
| Distance (in m) | Number of students |
| 0-10 | 4 |
| 10-20 | 5 |
| 20-30 | 13 |
| 30-40 | 20 |
| 40-50 | 14 |
| 50-60 | 8 |
| 60-70 | 4 |
Draw a less than type ogive for the given data and find the median distance thrown using this curve. [CBSE Sample Paper 2017-18)]
Answer:
| Less than | Number of Students |
| 10 | 4 |
| 20 | 9 |
| 30 | 22 |
| 40 | 42 |
| 50 | 56 |
| 60 | 64 |
| 70 | 68 |
Median distance is value of x that corresponds to
Cumulative frequency \(\frac{\mathrm{N}}{2}=\frac{67}{2}\) = 34
Therefore, Median distance = 36 m
Statistics Class 10 Extra Questions HOTS
Question 1.
Average cost of 5 apples and 2 pineapples is ₹ 250. The average cost of 7 apples and 4 pineapples is ₹ 340. Find the total cost of 24 apples and 12 pineapples.
Answer:
Average cost of 5 apples and 2 pineapples = ₹ 250
⇒ Total cost of 5 apples and 2 pineapples = ₹ (250 × 7)
= ₹ 1750 …(i)
Similarly, total cost of 7 apples and 4 pineapples = (₹ 340 × 11)
= ₹ 3740 …(ii)
(i) and (it)
⇒ Total cost of (5 + 7 = 12) apples and (2 + 4 = 6)
pineapples = ₹ 1750 + ₹ 3740 = ₹ 5490
Thus cost of 24 apples and 12 pineapples = ₹ (5490 × 2) = ₹ 10980
Question 2.
A student finds the average of 10 positive integers. Each integer contains two digits. By mistake, the boy interchanged the digits of one number. Due to this average becomes 1.8 less than the previous one. What was the difference of digits of the number which was wrongly written.
Answer:
Let the sum of 9 correct numbers be ‘A’ and the units and tens place digits of 10th number be x and y respectively.
∴ x̄ = \(\frac{\mathrm{A}+(10 x+y)}{10}\) …….(i)
When digits interchanged for 10th number its value becomes lOx + y.
By the condition, x̄ – 1.8 = \(\frac{\mathrm{A}+(10 x+y)}{10}\)
⇒ x = \(\frac{\mathrm{A}+(10 x+y)}{10}\) …(ii)
From (i) and (ii), we get
\(\frac{\mathrm{A}+(10 y+x)}{10}=\frac{\mathrm{A}+(10 x+y)}{10}\) + 1.8
⇒ A + (10x + y) + 18 = A + 10y + x
⇒ 9y – 9x = 18
⇒ y – x = 2
Thus the difference of digits = 2.
Multiple Choice Questions
Choose the correct option out of four given in each of the following:
Question 1.
In the given frequency distribution table, the values of missing frequency a1 and a2 respectively are:
| Cl. | Frequency | Cumulative frequency |
| 0-10 | 5 | a3 |
| 10-20 | a1 | 12 |
| 20-30 | 9 | 21 |
| 30-40 | a2 | 31 |
| 40-50 | 9 | fl4 |
(a) a1 = 5, a2 = 5
(b) a1 = 7, a2 = 5
(c) a1 = 7, a2 = 10
(d) a1 = 5, a2 = 10
Answer:
(c) a1 = 7, a2 = 10
Question 2.
For a frequency distribution, mean, median and mode are connected by the relation:
(a) Mode = 3 Mean – 2 Median
(b) Mode = 2 Median – 3 Mean
(c) Mode = 3 Median – 2 Mean
(d) Mode = 3 Median + 2 Mean
Answer:
(c) Mode = 3 Median – 2 Mean
Question 3.
The mean of a discrete frequency distribution xi|fi; i = 1, 2, 3, …………. n is given by
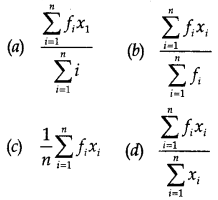
Answer:
(b) \(\frac{\sum_{i=1}^n f_i x_i}{\sum_{i=1}^n f_i}\)
Question 4.
In the formula x̄ = A + \(\frac{\sum f_i d_i}{\sum f_i}\) for finding the mean of grouped data d-s are deviations from A of:
(a) lower limits of the classes
(b) upper limits of the classes
(c) mid point of classes
(d) frequencies of the class marks.
Answer:
(c) mid point of classes
Question 5.
Construction of cumulative frequency table is useful in determining the
(a) mean
(b) median
(c) mode
(d) all, mean, mode and median.
Answer:
(b) median
Question 6.
In the formula x̄ = A + \(\frac{\sum f_i u_i}{\sum f_i}\) × h, for finding the mean of grouped frequency distribution, ui =
(a) (xi + A)/h
(b) h(xi – A)
(c) (xi – A)/h
(d) (A – xi)/h
Answer:
(c) (xi – A)/h
Question 7.
While computing mean of grouped data, we assume that the frequencies are:
(a) evenly distributed over all classes
(b) centered at the class marks of classes
(c) centered at upper limits of classes
(d) centered at lower limts of classes.
Answer:
(b) centered at the class marks of classes
Question 8.
If xi‘s are the mid points of the class intervals of grouped data, f’is are the corresponding frequencies and x is the mean, then Σfi(xi – x̄) is equal to:
(a) zero
(b) – 1
(c) 1
(d) 2
Answer:
(a) zero
Question 9.
Which of the following is not a measure of central tendency ?
(a) Mean
(b) Median
(c) Mode
(d) Variance
Answer:
(d) Variance
Question 10.
The mean of a set of numbers is x̄. If each number is divided by 3, then the new mean is:
(a) x̄
(b) x̄ + 3
(c) 3x̄
(d) \(\frac{\bar{x}}{3}\)
Answer:
(d) \(\frac{\bar{x}}{3}\)
Question 11.
Mean of a set of 8 observations is 10 and 4 is the mean of a set of 7 observations. The mean of the combined set is given by:
(a) 10.8
(b) 7.2
(c) 8.2
(d) 9
Answer:
(d) 9
Question 12.
The mode of a frequency distribution can be determined graphically from:
(a) histogram
(b) frequency polygon
(c) ogive
(d) frequency curve.
Answer:
(a) histogram
Question 13.
The algebraic sum of the deviations of a frequency distribution from its mean is:
(a) always positive
(b) always negative
(c) 0
(d) a non-zero number.
Answer:
(c) 0
Question 14.
The median of a given frequency distribution is found graphically with the help of:
(a) histogram
(b) frequency polygon
(c) frequency curve
(d) ogive.
Answer:
(d) ogive.
Question 15.
What is not true about mode ?
(a) It can be determined graphically
(b) It is the most frequent value
(c) The formula for finding mode is l + \(\left(\frac{f_1-f_0}{2 f_1-f_0-f_2}\right)\) × h
(d) None of these.
Answer:
(d) None of these.
Fill in the Blanks
Question 1.
That value of data from which algebraic sum of deviations of each observation vanishes is ____________ of the data.
Answer:
mean
Question 2.
The most frequent value of data is called ____________
Answer:
Mode
Question 3.
Another one word name for mean is ____________
Answer:
Average
Question 4.
If 50% of the observation lies above a value and another 50% alongside or below it, then this value is called as ____________
Answer:
Median
Question 5.
In case of categorical data ____________ is used as measure of central tendency.
Answer:
Mode
Question 6.
To find the mode of a grouped data, the size of the classes is ____________ (uniform/non-uniform)
Answer:
uniform
Question 7.
The class mark of a class interval p-q is ____________
Answer:
\(\frac{p+q}{2}\)
Question 8.
Two ogives, ‘less than’ type and ‘more than’ type of the same data intersect at the point P. The height of this point P represents ____________
Answer:
Half of total frequency
Question 9.
For a distribution with odd number (n) of observations, median = ____________.
Answer:
\(\left(\frac{n+1}{2}\right)^{\mathrm{th}}\) observation
Question 10.
For a distribution with even number (n) of observations, median = ____________.
Answer:
Mean of \(\left(\frac{n}{2}\right)^{\text {th }}\) and \(\left(\frac{n}{2}+1\right)^{\text {th }}\) observation