Practical Work in Geography Class 12 Solutions Chapter 1 Data – Its Source and Compilation
Class 12 Practical Work in Geography Chapter 1 NCERT Textbook Questions Solved
1. Choose the right answer from the four alternatives given below:
Question 1(i).
A number or character which represents measurement is called
(a) Digit
(b) Data
(c) Number
(d) Character
Answer:
(b) Data
Question 1(ii).
A single datum is a single measurement from the
(a) Table
(b) Frequency
(c) Real world
(d) Information
Answer:
(c) Real world
Question 1(iii).
In a tally mark grouping by four and crossing fifth is called
(a) Four and Cross Method
(b) Tally Marking Method
(c) Frequency plotting Method
(d) Inclusive Method
Answer:
Both
(a) Four and Cross Method
(b) Tally Marking Method
Question 1(iv).
An Ogive is a method in which
(a) Simple frequency is measured
(b) Cumulative frequency is measured
(c) Simple frequency is plotted
(d) Cumulative frequency is plotted
Answer:
(d) Cumulative frequency is plotted
Question 1(v).
If both ends of a group are taken in frequency grouping, it is called
(a) Exclusive method
(b) Inclusive method
(c) Marking method
(d) Statistical method
Answer:
(b) Inclusive method
2. Answer the following questions in about 30 words:
Question 2(i).
Differentiate between data and information.
Answer:
The data is defined as numbers that represent measurements from the real world. Datum is a single measurement. Thus, numerical information is called data. Information is defined as either a meaningful answer to a query or a meaningful stimulus that can cascade into further queries.
Question 2(ii).
What do you mean by data processing?
Answer:
Data processing is the process of organising, presenting, analysing and interpreting data. Once the data are collected, these data need to be organised, presented and analysed for proper interpretation.
Question 2(iii).
What is the advantage of footnote in a table?
Answer:
Footnote gives the necessary information about the statistics. For example, if we use abbreviation M and F for male and female respectively, it can be clarified through footnote. By giving a star mark, we also give source of data in footnote.
Question 2(iv).
What do you mean by primary sources of data?
Answer:
Primary data refers to the data which is originally collected by the investigator for the purpose of present enquiry directly from individuals or group of individuals using direct personal investigation, indirect personal investigation, mailing interview method, telephonic interview method, etc. It is also called first hand or original data. It is much more reliable as compared to secondary data.
Question 2(v).
Enumerate five sources of secondary data.
Answer:
- Published Printed Sources
- Books
- Journals/periodicals
- Magazines/newspapers
- Published Electronic Sources
- E-journals
- General websites
- Weblogs
- Unpublished personal records
- Government records
- Central Statistical Office (CSO) and National Sample Survey Office (NSSO)
3. Answer the following questions in about 125 words:
Question 3(i).
Discuss the national and international agencies where from secondary data may be collected.
Answer:
National and international agencies from where secondary data may be collected are given below:
1. Government Publications: The publications of the various ministries and the departments of the Government of India, State Governments and the District Bulletins are one of the most important sources of secondary information. These include the Census of India published by the Office of the Registrar General of India, reports of the National Sample Survey, Weather Reports of Indian Meteorological Department, and Statistical Abstracts published by state governments, and the periodical reports published by different Commissions.
2. Semi/Question uasi-government Publications: The publications and reports of Urban Development Authorities and Municipal Corporations of various cities and towns, Zila Parishads (District Councils), etc. fall under this category.
3. International Publications: The international publications comprise yearbooks, reports and monographs published by different agencies of the United Nations such as United Nations Educational, Scientific and Cultural Organisation (UNESCO), United Nations Development Programme (UNDP),World Health Organisation (WHO), Food and Agricultural Organisation (FAO), etc. Some of the important publications of the United Nations that are periodically published are Demographic Year Book, Statistical Year Book and the Human Development Report.
4. Private Publications: The yearbooks, surveys, research reports and monographs published by newspapers and private organisations fall under this category.
5. Newspapers and Magazines: The daily newspapers and the weekly, fortnightly and monthly magazines serve as easily accessible source of secondary data. (fi Electronic Media: The electronic media specially internet has emerged as a major source of secondary data in recent times.
Question 2(ii).
What is the importance of an index number? Taking an example examine the process of calculating an index number and show the changes.
Answer:
Index numbers are statistical devices designed to measure the relative change in the level of variable or group of variables with respect to time, geographical location, etc. In other words, these are the numbers which express the value of a variable at any given period called ‘current period’ as a percentage of the value of that variable at some standard period called “base period’.
Index numbers are indispensable tools of economics and business analysis. Following are the main uses of index numbers. Index numbers are used as economic barometers. Index numbers help in formulating suitable economic policies and planning. They are used in studying trends and tendencies. Businessmen need to know the trends in the market to take decisions about wage rates, prices of the product, prices of raw materials, etc. Therefore, index numbers are very useful for them. They provide information regarding foreign trade. They are useful in forecasting future economic activity. The cost of living index numbers determines .whether the real wages are rising or falling or remain constant. It is used in deflating. For example, suppose rice sells at ?9/kg at BBSR in 2005 as compare to ₹ 4.50/Kg in 1985.
Therefore the index number of price of rice in 2005 compared to 1985 is calculated as
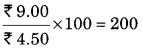
This means that there is a net increase of 100% in the price of rice in 2005 as compared to 1985. [The base year’s index number is always treated as 100]
Suppose, during the same period 2005 the rice sells at Rs. 12.00/kg in Delhi. Therefore, the index number of price at Bhubaneswar compared to price at Delhi is
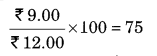
This means that there is a net decrease of 25% in the price of rice in 2005 as compared to 1985.
The above index numbers are called ‘Price Index Numbers’.
To take another example the production of rice in 2012 in Orissa was 42,000 metric tons in comparison to 36,000 metric tons in 2001. So the Index Number of the quantity produced in 2012 compared to 2001 is
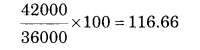
That means that there is a net increase of 21.61% in production of rice in 2012 as compared to 2001.
ACTIVITY
Question 1.
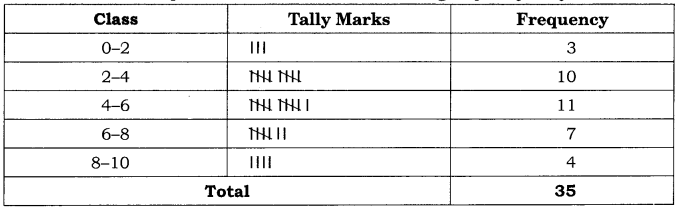
In a class of 35 students of Geography, following marks were obtained out of 10 marks in unit test – 1, 0, 2, 3, 4, 5, 6, 7, 2, 3, 4, 0, 2, 5, 8, 4, 5, 3, 6, 3, 2, 7, 6, 5, 4, 3, 7, 8, 9, 7, 9, 4, 5, ‘4, 3. Represent the data in the form of a group frequency distribution.
Answer:
Question 2.
Collect the last test result of Geography of your class and represent the marks in the form of a group frequency distribution
Answer:
Do yourself.
Class 12 Practical Work in Geography Chapter 1 NCERT Extra Questions
Class 12 Practical Work in Geography Chapter 1 Very Short Answer Type Questions
Question 1.
What do you mean by data?
Answer:
Numerical and quantitative measurement of geographical events, human activities and their interrelationship are called data.
Question 2.
When do we get meaningful result from collected data?
Answer:
Data collected are required to be organised and presented and then analysed. Only then we can reach at meaningful conclusions from data.
Question 3.
Explain different methods of presentation of data.
Answer:
There can be many methods of presenting the data like: tabulation of data (in absolute terms, in percentage or ratio); graphical presentation, pictoral presentation or presentation using maps.
Question 4.
Name two important sources of collecting data.
Answer:
Two important sources of collecting data are primary data and secondary data.
Question 5.
What are absolute data?
Answer:
When data are presented in their original form as integers, they are called absolute data or raw data. For example, the total population of a country or a state, the total production of a crop or a manufacturing industry, etc.
Question 6.
Differentiate between primary and secondary data.
Answer:
Primary Data: The data which are collected for the first time by an individual or the group of individuals, institution/organisations are called Primary sources of the data. Secondary Data: Data which are collected from any published or unpublished sources are called Secondary sources.
Question 7.
Why is it necessary to convert data into percentage or ratio?
Answer:
Sometimes data are tabulated in a ratio or percentage form that are computed from a common parameter, such as literacy rate or growth rate of population, percentage of agricultural products or industrial products, etc. It is important because absolute data cannot be compared.
Question 8.
What do you mean by index numbers?
Answer:
Index numbers are statistical devices designed to measure the relative change in the level of variable or group of variables with respect to time, geographical location, etc. In other words, these are the numbers which express the value of a variable at any given period called ‘current period’ as a percentage of the value of that variable at some standard period called ‘base period’.
Question 9.
Why is it necessary to analyse the collected data?
Answer:
When we collect data, it is in absolute terms. We need to organise and present these data. After organisation and presentation, these data are converted into percentage and ratio. Thereafter, we need to calculate mean, median, mode, etc. to reach at the conclusion. Therefore, it is necessary to analyse collected data.
Question 10.
Explain the methods adopted to determine class size of data.
Answer:
The grouping of the raw data requires determining of the number of classes in which the raw data are to be grouped and what will be the class intervals. The selection of the class interval and the number of classes, however, depends upon the range of raw data. For example, if raw data is more expanded we can take class interval as 0-10, 10-20, etc. if it is less expanded, class interval can be 0-2, 2-4, etc.
Question 11.
What do you mean by frequency distribution?
Answer: A frequency distribution divides observations in the data set into conveniently established numerically ordered classes (groups or categories). The number of observations in each class is referred to as frequency denoted as f.
Question 12.
Give the difference between normal frequency and cumulative frequency.
Answer:
Simple Frequencies: It is expressed by ‘f and represent the number of individuals falling in each group. On the other hand, Cumulative Frequencies are expressed by ‘Cf and can be obtained by adding successive simple frequencies in each group with the previous sum.
Question 13.
What do you mean by frequency distribution polygon?
Answer:
A graph of frequency distribution is known as the frequency polygon. It helps in comparing the two or more than two frequency distributions. The two frequencies ‘ are shown using a bar diagram and a line graph respectively.
Question 14.
What do you mean by Ogive?
Answer:
When the frequencies are added they are called cumulative frequencies and are listed in a table called cumulative frequency table. The curve obtained by plotting cumulative frequencies is called an Ogive. It is constructed either by the less than method or the more than method.
Class 12 Practical Work in Geography Chapter 1 Short Answer Type Questions
Question 1.
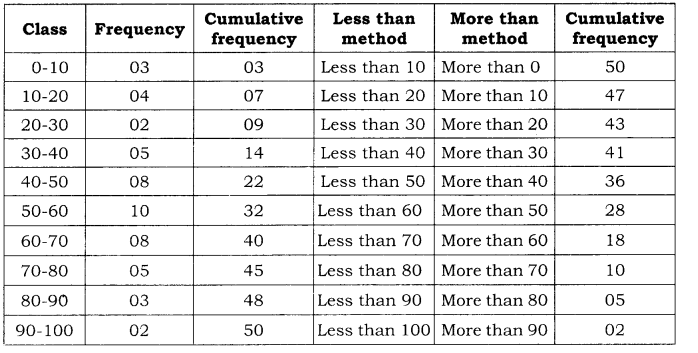
Explain the exclusive method by less than and more than cumulative frequencies.
Answer:
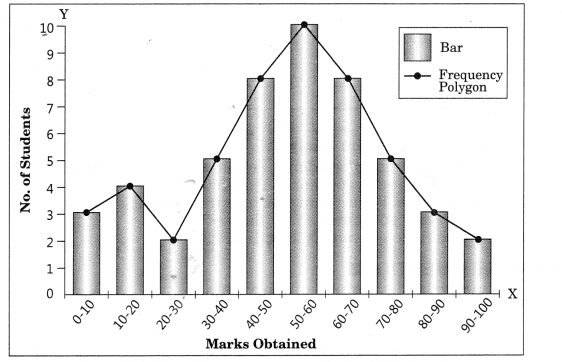
Question 2.
Exhibit the above data using a frequency polygon.
Answer:
Question 3.
Explain the difference between inclusive method and exclusive method.
Answer:
An inclusive method is one in which there is generally a difference between the upper limit of one class interval and the lower limit of the other class interval. For example, 0-9, 10-19, 20-29 are inclusive classes because it includes 9, 19, 29, etc. On the ‘ other hand, an exclusive method is one in which there is generally no difference between the upper limit of one class interval and the lower limit of the other class interval. For example, 0-10, 10-20, 20-30 are examples of exclusive classes because 10, 20, 30 are not included in the classes where these are upper limits.
Class 12 Practical Work in Geography Chapter 1 Long Answer Type Questions
Question 1.
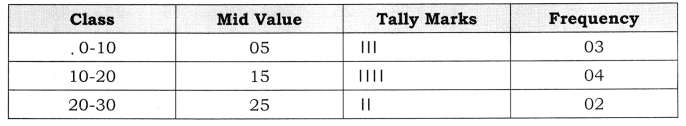
Explain the procedure of tabulating and making frequency distribution with the help of an example.
Marks obtained by students in Geography are given below.
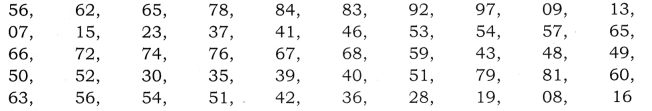
Make a frequency distribution.
Answer:
Step-1: Find the difference between the largest and the smallest items. Highest value is 97 and lowest value is 7. Therefore, the difference is 90 (97-7).
Step-2: Keeping in mind the range the class interval will be 10 and classes will be 0-10, 10-20, 20-30, etc.
Step-3: It is to be noted that upper limit is excluded and lower limit is included in the class, i.e. the value 30 will be included in 30-40 not in 20-30.
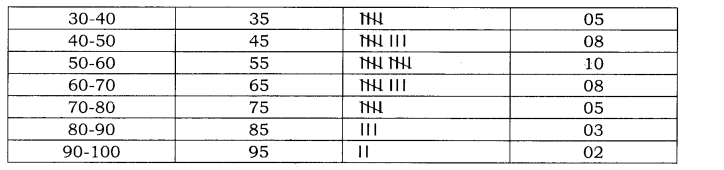
Conclusions derived from analysis:
- The highest number of students lie in the class interval 50-60, i.e. 10.
- Only 3 students have got marks between 0-10.
- Only 14 students have got marks less than 40%.
- 2 students have got marks more than 90.
- 48 students have got marks less than 90.
Class 12 Practical Work in Geography Chapter 1 Viva Questions
Question 1.
Give two methods of collecting primary data.
Answer:
Direct oral investigation and interview method.
Question 2.
Give two examples where geographers use secondary data.
Answer:
Geographers use secondary data to find various information. Geographical Survey of India collects data and others use it for different purposes.
Question 3.
Is Internet primary or secondary method of data collection?
Answer:
It is a secondary method of data collection.
Question 4.
What is cumulative frequency?
Answer:
It is summation of frequencies for particular class intervals. It can be obtained by adding successive simple frequencies in each group with the previous sum.
Question 5.
Give two examples of quantitative data.
Answer:
Temperature and rainfall.
Question 6.
Give two examples of qualitative data.
Answer:
Diversity of flora and fauna, forest quality.
Question 7.
What is stub?
Answer:
Heading of a row in a table is called stub.
Question 8.
What is caption?
Answer:
Heading of a column in a table is called caption.
Data – Its Source and Compilation Notes
- Numerical and quantitative measurement of geographical events, human activities and their interrelationship are called data. In other words, quantitative information is called datum. Therefore, data are also called quantitative information. Numbers that define measurement from real world.
- It may be easily realized that there are large volume of data available around the world today. However, at times, it becomes difficult to derive logical conclusions from these data if they are in a raw form. Hence, it is important to ensure that the measured information is algorithmically derived and/or logically deduced and/or statistically calculated from multiple data.
- The use of statistical methods in the analysis, presentation and in drawing conclusions plays a significant role in almost all disciplines, including geography, which use the data.
- It may, therefore, be inferred that the concentration of a phenomena, e.g. population, forest or network of transportation or communication not only vary over space and time but may also be conveniently explained using the data.
- Analytical tools and techniques have become more important these days to make the study more logical and derive precise conclusion. Precise quantitative techniques are used right from the beginning of collecting and compiling data to its tabulation, organisation, ordering and analysis till the derivation of conclusions.
- The data are collected through the following ways. These are:
(i) Primary Sources (ii) Secondary Sources. - The data which are collected for the first time by an individual or the group of individuals, institution/organisations are called primary sources of the data.
- Data collected from any published or unpublished sources are called secondary sources.
- When data are presented in their original form as integers, they are called absolute data or raw data. For example, the total population of a country or a state, the total production of a crop or a manufacturing industry, etc.
- Percentage/Ratio: Sometimes data are tabulated in a ratio or percentage form that are computed from a common parameter, such as literacy rate or growth rate of population, percentage of agricultural products or industrial products, etc.
- An index number is a statistical measure designed to show changes in variable or a group of related variables with respect to time, geographic location or other characteristics. It is to be noted that index numbers not only measure changes over a period of time but also compare economic conditions of different locations, industries, cities or countries. Index number is widely used in economics and business to see changes in price and quantity. There are various methods for the calculation of index number.
- The grouping of the raw data requires determining of the number of classes in which the raw data are to be grouped and what will be the class intervals. The selection of the class interval and the number of classes, however, depends upon the range of raw data.
Data – Its Source and Compilation Important Terms
- Data: Numerical and quantitative measurement of geographical events, human activities and their interrelationship are called data.
- Information: Information is defined as either-a meaningful answer to a query or a meaningful stimulus that can cascade into further queries.
- Primary Data: The data which are collected for the first time by an individual or the group of individuals, institution/organisations are called Primary sources of the data.
- Secondary Data: Data which are collected from any published or unpublished sources are called Secondary sources.
- Inclusive Method: Under this method, upper limit of a class is not the lower limit of next class. It includes lower limit as well as upper limit in the class interval.
- Exclusive Method: Under this method, upper limit of a class is the lower limit of next class. It does not include upper limit in the class interval.
- Simple Frequencies: It is expressed by ‘f and represent the number of individuals falling in each group.
- Cumulative Frequencies: It is expressed by ‘Cf and can be obtained by adding successive simple frequencies in each group with the previous sum.
- Frequency Polygon: A graph of frequency distribution is known as the frequency polygon. It helps in comparing the two or more than two frequency distributions. The two frequencies are shown using a bar diagram and a line graph respectively.
- Ogive: When the frequencies are added they are called cumulative frequencies and ‘ are listed in a table called cumulative frequency table. The curve obtained by plotting cumulative frequencies is called an Ogive. It is constructed either by the less than method or the more than method.