Class 6 Social Science Chapter 1 Notes Locating Places on the Earth
Map :
- A map is a representation, or a drawing, of an area. A map can be drawn for a small area (a village, a town, etc.), a bigger area (district or state), or a vast area like India or even the whole world.
- An Atlas is a book or collection of maps.
There are several kinds of maps. These are as follows
- Physical Maps Physical maps are used to show natural features such as mountains, oceans and rivers.
- Political Maps Such maps show details of countries or states, boundaries, cities, etc. For example, a map of India with all its States, Union Territories and their capitals.
- Thematic Maps These maps are used to show specific kind of information. For example, settlements and transportation.
Components of Map :
There are three important components of maps i.e. distance, direction and symbols.
i. Distance
- The actual distance between two points on the map depends on the scale. The scale is represented in the bottom left corner of the map.
- Each centimetre on the map represents a certain distance on the ground. For example; we say that the scale is 1 cm = 500 m. This means every 1 cm on the map is equal to 500 m on the ground.
![]()
ii. Direction
- The arrow at the top right of the map is used to point the direction. Most maps simply have an arrow marked with the letter ‘ N ‘, which points to the North direction.
- By moving the map in a clockwise direction one can locate, the East, South and West directions. These are called the cardinal directions or cardinal points. Other than these, intermediate directions are also used.
These are North-East (NE), South-East (SE), South-West (SW) and North-West (NW).
iii. Symbols
- Symbols are small drawings and representations on the map of large physical structures on the ground. All the elements like building cannot be drawn on the map of a large city or a country, thus, symbols are used for representing these elements on the map.
- The symbols are used to represent features such as railways, roads, police stations, hospitals, trees, lakes, ponds, etc. In this way, numerous details can be shown in the limited space available on a map.

- Different countries use different sets of symbols. Specific symbols are used by mapmakers to make maps more easily understood by different users. You can notice several symbols in the map given below that show trees, roads, railway tracks and houses.
- The Survey of India has fixed a set of symbols for maps of India (or parts of India).
![]()
Mapping the Earth :
- A globe is used for actual representation of the Earth, then a flat map.
- Mapping the Earth is difficult because our planet is not a flat surface. It nearly has the shape of a sphere or it is not a perfect sphere. Representing a sphere accurately on a flat sheet of paper is not possible.
- When a spherical surface is flattened, distortions occur in the size, shape, distance and direction of landmasses. In this, the actual representation of the Earth and its features gets disrupted. Thus, the globe is used for mapping the Earth because both the Earth and the globe have the same spherical shape.
Understanding Coordinates :
A system of coordinates is used in the world of maps to determine the location of any place on a map. This includes latitudes and longitudes.
Latitudes :
- Latitudes are imaginary lines drawn on the globe. These run East and West, parallel to the Equator. Such lines are called parallels of latitude and draw a circle around the Earth. The largest circle is the Equator.
- Latitudes are expressed in degrees. By convention, the Equator is 0° (zero degrees) latitude, while the latitudes of the two poles are 90° North and 90° South respectively. The North and South Poles are noted as 90° N and 90° S, respectively.
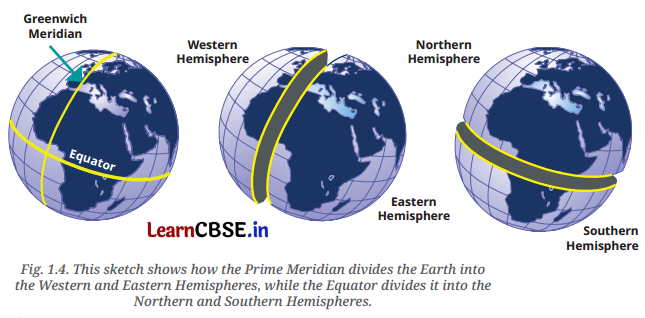
- The Equator divides the Earth into the Northern and Southern Hemispheres.
- It is easy to identify the North Pole and the South Pole on the globe. The fixed points at the top and bottom are the two poles.
- The North Pole and South Pole are at an equal distance from the Equator. As we move towards the pole, the distance between us and the Equator increases.
- There is a relationship between latitude and climate. Near the Equator, the climate is generally hot (also called torrid).
- As we move away from the Equator towards one of the two poles, the climate becomes more moderate (or temperate). As we move closer to the North or South Pole, the climate becomes colder (or ‘frigid’).

Longitudes :
- The imaginary lines of half-circles running from one pole to the other are called meridians of longitude.
- To measure longitudes, we need to define a reference point called the Prime Meridian. It is also called Greenwich Meridian because, in the year 1884, some nations decided that the meridian passing through Greenwich, an area of London in England, would become the international standard for the Prime Meridian. It is marked as 0° longitude.
- The Prime Meridian divides the Earth into the Western and Eastern Hemispheres.
- While latitude is a measure of the distance from the Equator if you travel towards one of the poles, longitude is a measure of the distance from the Prime Meridian.
- Longitude is also measured in degrees. Longitudes are measured in the East and West directions. The values of longitudes are between 0° to 180°. For example, New York is located on 74° W longitude, while Delhis is 77° E and Tokyo is 140° E.
- By measuring the longitude of a place, we can also measure the time at that place.
- By slowly rotating the globe Eastward, we can note that for some places on the Earth, it is morning, while for others it is midday, evening or night.
![]()
Grid Lines :
- Latitude and longitude together are the two coordinates of a place. With the help of these co-ordinates, we can locate any place on Earth.
- To locate a place on the Earth all the lines of latitudes and longitudes together constitute a grid for the globe. They are also called grid lines.
- 180° W and 180° E are the same longitude on the globe. Hence, this longitude is noted as 180°, without the letter W or E.
Indian Prime Meridian :
- The Greenwich Meridian is not the first prime meridian.
- Many centuries ago India had a prime meridian of its own. It was called Madhya rekha (or ‘middle line’). It passed through the city of Ujjayini (today Ujjain). It was a reputed centre for astronomy for many centuries. A famous astronomer, Varahamihira lived and worked there some 1,500 years ago.
- Indian astronomers were aware of concepts of latitude and longitude, including the need for a zero or prime meridian.
- The Ujjayini meridian became a reference for calculations in all Indian astronomical texts.
Understanding Time Zones :
- The Earth rotates in a West to East direction around its axis. This one rotation takes 24 hours.
- Since a full rotation is 360 degrees, the earth turns 15 degrees each hour (15 degrees multiplied by 24 hours equals 360 degrees).
- Let’s mark the meridians of longitude every 15 degrees. Starting from the Prime Meridian, we have 0°, 15° E, 30° E, 45° E and so on, up to 180° E. Each meridian represents one hour of local time. For example, if it is 12 pm (noon) at Greenwich (0°), it will be 1 pm at 15° E, 2 pm at 30° E and so on.’
- When moving Westwąrd from the Prime Meridian, the time decreases. For example, it will be 11 am at 15° W and 10 am at 30° W. The same method can be used to calculate the local time of any place on the Earth.
- All these standard times are organised in time zones, which broadly follow the zones of 15°. The lines dividing the time zones are not straight. This is because they have to respect each country’s standard time and, therefore, tend to follow international borders.
- Most countries adopt a standard time based on a meridian passing through them.
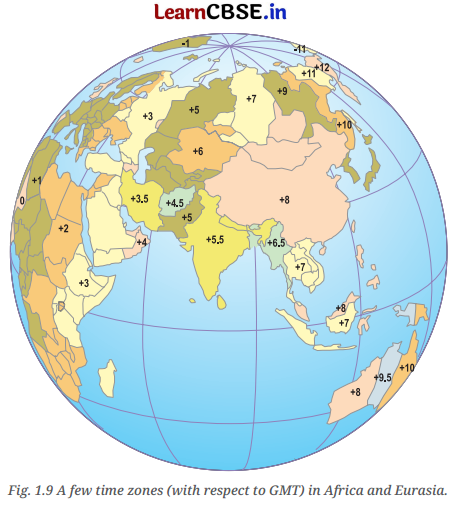
- As we move farther from the Greenwich Prime Meridian towards the East we are required to add hours to the Greenwich Mean Time (GMT). On the other hand, if we move towards the West we are supposed to subtract hours from the Greenwich Mean Time (GMT).
- Indian Standard Time (IST) is 5 -hours 30 minutes (also noted as 5.5 hours) ahead of the local time at Greenwich (called Greenwich Mean Time or GMT).
- While the Prime Meridian was fixed at Greenwich, the opposite line at approximately 180° longitude is called the International Date Line. The +12 and the -12 time zones touch each other at this line.
- If we cross the International Date Line travelling Eastward, we have to subtract a day (say, from Monday to Sunday). On the other hand, if we cross it travelling Westward, we have to add a day (from Sunday to Monday).
→ Axis: The Earth’s axis is an imaginary line that runs from the North Pole to the South Pole, around which the Earth rotates.
→ Equator: The Equator is an imaginary line around the middle of the Earth, at an equal distance from the North and South Poles, dividing the Earth into the Northern and Southern Hemispheres.
→ Globe: A globe is a spherical model of Earth that accurately represents its continents, oceans and geographical features.
→ Grid lines: Grid lines are the network of intersecting horizontal and vertical lines on maps and globes used to locate a particular place.
→ The globe of the Earth stands in space, made up of water, earth, fire and air and is spherical…. It is surrounded by all creatures, terrestrial as well as aquatic. – Aryabhata (about 500 CE
→ Imagine that you are visiting a city for the first time. How would you find the places you want to visit? You might ask a local person for help, or you might look at a map of the city. In previous grades, you learnt a little about maps, and in this chapter, we will study them in more detail.
→ Let us play a game. Examine the map of this small city (Fig. 1.1). Imagine that you just got off a train at the railway station, and you want to visit the bank marked on the map. Which way would you go? Are there other possible ways? Can you locate the public garden, the school and the museum? If you want to proceed from the bank to the market, which way will you go? This is where a map comes in handy!

A map is like a treasure guide; it shows you where things are and how to get to them. Notice the four arrows in the top right corner of the map; we will soon see how they point to some specific directions and make maps even more helpful.
LET’S EXPLORE
→ On the map in Fig. 1.1 given on page 8 –
- Mark the hospital.
- What is the meaning of the blue-coloured areas?
- Which is farther away from the railway station — the school, the Nagar Panchayat or the public garden?
→ As a class activity, form groups of three or four students each. Let each group try to draw a map of your school and some of the streets or roads that lead to it, and a few neighbouring buildings. At the end, compare all the maps and discuss.
![]()
A Map and Its Components
From this simple example, we understand that a map is a representation, or a drawing, of some area – it may be a small area (a village, a town, etc.), a bigger area (say, your district or state), or a very large area like India or even the whole world. In a map, you look at the surface as if you are viewing it from the top.
An atlas is a book or collection of maps.
As you will discover, there are several kinds of maps –
- physical maps, which mainly show some natural features such as mountains, oceans and rivers (see an
example in Fig. 5.2 in this textbook) - political maps, which show details of countries or states, boundaries, cities, etc. (for instance, a map of
India with all its States, Union Territories and their capitals) - thematic maps, with a specific kind of information (examples include Fig. 6.3 and Fig. 8.1 in this textbook).
In addition, there are three important components of maps—distance, direction and symbols. You have already experienced the first two while navigating the map in Fig. 1.1. Let us now define them more precisely.
Have you ever wondered how a huge place can fit on a small piece of paper? It is all thanks to the map’s scale. Let us go back to our map of a small city (Fig. 1.1). Each centimetre on the map, as printed here, represents a certain distance on the ground – let us suppose it is 500 metres; we say that the scale is 1 cm = 500 m. Now, turn to the map of India in Fig. 5.2 in Chapter 5 of this textbook. The scale is repre¬sented in the bottom left corner by a ruler with ‘500’ written above its length and ‘km’ on the side. It simply means that this ruler, which measures 2.5 cm in the printed map, corresponds to 500 kilometres on the ground.
So, the actual distance between two points represented on the map depends on the scale that the map is using.
LET’S EXPLORE
→ Draw a simple map of a school’s playground. Let us assume it is a rectangle, 40 m in length and 30 m in width. Draw it precisely with your ruler on a scale of 1 cm = 10 m.
→ Now measure the diagonal of the rectangle. How many centimetres do you get? Using the scale, calculate the real length of the playground’s diagonal, in metres.

Let us return to the four arrows at the top right of the small city’s map. They point to four directions, which are north, at the top, and, moving clockwise, east, south and west. These are called the cardinal directions, also cardinal points. Other than these, intermediate directions are also used — northeast (NE), southeast (SE), southwest (SW) and northwest (NW). Most maps simply have an arrow marked with the letter ‘N’, which points to the north direction.
LET’S EXPLORE
→ Consider the map of the small city again. Identify the correct and incorrect statements in the list below:
- The market is north of the hospital.
- The museum is southeast of the bank.
- The railway station is northwest of the hospital.
- The lake is northwest of the apartment blocks.
→ Taking your school as the starting point, do you know approximately in which cardinal direction your home is located? Discuss with your teacher and your parents.
Symbols are another important component of maps. Our map has small drawings of actual buildings and a few other elements, but there would not be enough space on the map of a large city or a country to draw them all. Instead, a symbol is used to represent these features – symbols for different kinds of buildings (for instance a railway station, a school, a post office), for roads and railway lines, and for natural elements such as a river, a pond or a forest. In that way, numerous details can be shown in the limited space available on a map.
To make maps more easily understood by a variety of users, map makers use specific symbols. Different countries use different sets of symbols. The Survey of India, a government body, has fixed a set of symbols for maps of India (or parts of India). A small selection of them is shown in Fig. 1.2 on page 12.
LET’S EXPLORE
Draw a rough map of your locality or your village, including your home, school and a few other important landmarks. Show the cardinal directions and use a few of the symbols shown in Fig. 1.2 on page 12 to mark some important features.

Mapping the Earth
Mapping the Earth is a little more difficult because our planet is not a flat surface. It nearly has the shape of a sphere. (We say ‘nearly’ because it is not a perfect sphere, but is slightly flattened at the poles. However, in practice, we will consider it to be spherical.) Representing a sphere accurately on a flat sheet of paper is not possible. To understand why, peel an orange in such a way that you have just three or four large pieces of the skin; then try and flatten them on a table – you will see that you cannot do it without tearing them at the edges.
Now, consider a globe, which is a sphere on which a map is drawn. This may be a map of the Earth, the Moon, the planet Mars, the stars and constellations in the sky, etc. The physical object, like the one shown in the drawing on the next page, is a sphere that is generally made of metal, plastic or cardboard.
Here we will study the globe representing the Earth’s geography. Because the globe and the Earth have the same spherical shape, a globe will better represent the geography of the Earth than a flat map.
Let us now explore some of its features.

a) Understanding coordinates
Imagine a big market in a city or town, with neat rows of shops, all the same size. You want to meet a friend at a stationery shop inside the market. But your friend does not know where the shop is. So you would give directions like, “Meet me at 6 pm at the 7th shop in the 5th row from the entrance.” This will allow your friend to precisely determine your location.
Now, consider a chessboard.
To record moves by advanced players, letters are placed alongside the main pieces (from ‘a’ to TT, see the image) and numbers (from 1 to 8) in between the two sides. This simple system allows players to mark each square and record every move. Here, the white side has just opened the game by moving the queen’s pawn two squares forward (a very common opening). So, the pawn is said to have moved from d2 to d4.
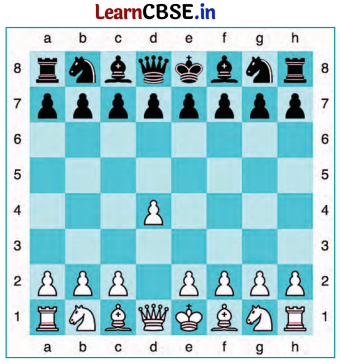
![]()
LET’S EXPLORE
Using the same terms, write down your move if you play black and respond with the same move.
The system used in these two examples may be called a system of coordinates. Thanks to their two coordinates, the stationery shop as well as the chess square on the chessboard can be precisely determined.
A similar system of coordinates is used in the world of maps to determine the location of any place on a map. Let us see how this system works.
b) Latitudes
Let us return to the globe. It is easy to identify the North Pole and the South Pole on it. Rotate the globe; while it rotates, the fixed points at the top and bottom are the two poles. Halfway between them is the Equator; note the circle marking it (see Fig. 1.3).
Imagine that you stand on the Equator and travel towards one of the poles; your distance from the Equator increases. Latitude measures this distance from the Equator. At any point of this travel, you can draw an imaginary line that runs east and west, parallel to the Equator. Such a line is called a parallel of latitude and it draws a circle around the Earth. Again, it is easy to note on the globe that the largest circle is the Equator, while the circles marked by the parallels of latitude grow smaller as we move northward or southward (Fig. 1.3).
Latitudes are expressed in degrees; by convention, the Equator is latitude 0° (zero degree), while the latitudes of the two poles are 90° North and 90° South respectively; this is noted 90°N and 90°S.
There is a connection between latitude and climate. Around the Equator, the climate is generally hot (it is also called Torrid’). As you travel away from the Equator towards one of the two poles (in other words, as your latitude increases), the climate becomes more moderate (or Temperate’). And closer to the North or South Pole, the climate grows colder (or ‘frigid’). You will learn in Science why this is so, and also why we experience different seasons in the course of a year.

c) Longitudes
Imagine now that you travel from the North Pole to the South Pole by the shortest possible line. Observe the globe: you will see that instead of passing through Europe and Africa, you could just as well pass through Asia – the distance would be the same. These lines are called meridians of longitude (Fig. 1.3). They are all half-circles running from one pole to the other.
You will also learn in Science that the Earth spins on its axis. To put it simply, let’s place a desk lamp a little away from our globe, focused on it, and imagine that this is the Sun illuminating the Earth. Slowly rotating the globe eastward, we can note that for some places on the Earth it is morning, while for others it is mid-day, evening or night – when it’s breakfast time in one country, it’s lunchtime in another and in a third country people are fast asleep! That is why by measuring the longitude of a place, we will also be measuring the time at that place. Let us see how.
To measure longitudes, we need to define a reference point called the Prime Meridian (Fig. 1.3 on page 15). It is also called Greenwich Meridian because, in the year 1884, some nations decided that the meridian passing through Greenwich, an area of London in England, would become the international standard for the Prime Meridian. It is marked as 0° longitude.
Just as latitude is a measure of the distance from the Equator if you travel towards one of the poles, longitude is a measure of the distance from the Prime Meridian if you travel along the Equator. Longitude, too, is measured in degrees. Westward or eastward, it increases in value from 0° to 180°, with the letter ‘W’ or ‘E’ added. For instance, using round figures, New York’s longitude is 74°W, while Delhi’s is 77°E and Tokyo’s is 140°E.
DON’T MISS OUT
As you can see on the globe of meridians of longitudes, 180°W and 180°E are the same longitude; so this longitude is noted 180°, omitting the letter W or E.
Latitude and longitude together are the two coordinates of a place. With them, you are now able to locate any place on Earth! You can now understand a statement such as “Delhi lies at 29°N latitude and 77°E longitude” (these values are rounded off, not exact).
Fig. 1.3 on page 15 shows the parallels of latitude and the meridians of longitude together on the globe as blue lines.
All these lines together constitute a grid for the globe; they are also called grid lines.
LET’S EXPLORE
If the globe or atlas in your class has well-marked latitudes and longitudes, try to note down approximate values for the latitude and longitude of (1) Mumbai, (2) Kolkata, (3) Singapore, (4) Paris.
DONT’ MISS OUT
The Greenwich Meridian is not the first prime meridian. There were others in the past. In fact, many centuries before Europe, India had a prime meridian of its own! (Fig. 1.5) It was called madhya rekha (or ‘middle line’) and passed through the city of Ujjayin! (today Ujjain), which was a reputed centre for astronomy over many centuries. Varahamihira, a famous astronomer, lived and worked there some 1,500 years ago.
Indian astronomers were aware of concepts of latitude and longitude, including the need for a zero or prime meridian. The Ujjayin! meridian became a reference for calculations in all Indian astronomical texts.
The map shows a few ancient Indian cities close to the Ujjayini meridian. Some are very close to it, while others are a little away. That is because measuring longitude required accurate timekeeping, which was not as precise then as it is today.


![]()
Understanding Time Zones
Let’s make the globe rotate again from west to east – that is how our planet spins around its axis, making a full turn every 24 hours. A full turn is 360°, so this means 15° per hour (15 × 24 = 360). Let us now mark the meridians of longitude every 15°. Moving eastward from the Prime Meridian, we get 0°, 15°E, 30°E, 45°E, and so on every 15° up to 180°E. It is the same as adding one hour of local time with each meridian – if it is 12 pm or noon at Greenwich, it is 1 pm local time at 15°E, 2 pm at 30°E, and so on. But going westward, it is the other way round – 11 am local time at 15°W, 10 am at 30°W, etc.

LET’S EXPLORE
Two friends, one sitting in Porbandar (Gujarat) and the other in Tinsukia (Assam), are speaking on the phone late afternoon. The latter remarks that the sun has set in Assam and it’s now dark. The former is surprised and says, “But it’s still full daylight here!” Explain why. And, as a class activity, calculate the difference in local time between those two cities. (Hint: for now, consider the difference in longitude between Porbandar and Tinsukia to be 30°; later, you can find out the precise value.)
The same method can be used to calculate the local time of any place on the Earth. But it would not be convenient for a country to use many local times! That is why most countries adopt a standard time based on a meridian passing through them. Indian Standard Time (1ST) is 5 hours 30 minutes (also noted 5.5 hours) ahead of the local time at Greenwich (called Greenwich Mean Time or GMT).
LET’S EXPLORE
Return to the two friends sitting in Gujarat and Assam. Use this example to explain the difference between local time and standard time.
All these standard times are organized in time zones, which broadly follow the zones of 15° in the graph (Fig. 1.7). But let us consider the world map below (Fig. 1.8). We can see that the lines dividing the time zones are not fully straight. This is because they have to respect each country’s standard time and, therefore, tend to follow international borders. The numbers written inside some countries are the numbers of hours to be added to GMT to get their standard times if they have a positive sign, or subtracted from GMT if they have a negative sign.

![]()
DON’T MISS OUT
From the above explanation, it may seem as if every country has one standard time. That is not always the case. Some countries, like Russia, Canada or the USA, are too large to have a single time zone. The USA has six time zones and Russia has 11 – which means that travelling across Russia from east to west, you will need to readjust your watch 10 times to align with the local time!
Similarly, the globe in Fig. 1.9, centred on India, shows standard times with respect to GMT for a few countries.
Finally, while the Prime Meridian was fixed at Greenwich, the opposite line – at approximately 180° longitude – is called the International Date Line.
As you can see on the map, the +12 and the -12 time zones touch each other at this line. If you cross it by ship or plane, you need to change the date in your watch. If you cross it
travelling eastward, you subtract a day (say, from Monday to Sunday); if you cross it travelling westward, you add a day (from Sunday to Monday). We said that the International Date Line is ‘approximately’ at 180° longitude, as it deviates in places to avoid dividing some countries into two different days!
Before we move on …
- Maps are a very useful tool to represent an area of the Earth, whether small or large. The main components of maps are distance, direction and symbols.
- Every place on the Earth has a location which can be precisely defined with the help of a grid of latitudes and longitudes – imaginary lines running from east to west (parallel to the Equator) and north to south (from pole to pole) respectively.
- Longitude also marks the time and defines the time zones.
- The International Date Line is located approximately at 180 degrees longitude, opposite the Prime Meridian. Crossing the International Date Line changes the date by one day.