Students must start practicing the questions from CBSE Sample Papers for Class 11 Economics with Solutions Set 4 are designed as per the revised syllabus.
CBSE Sample Papers for Class 11 Economics Set 4 with Solutions
Time : 3 Hours
Maximum Marks : 80
General Instructions:
- This question paper contains two sections:
Section A – Statistics for Economics Section B – Introductory Micro Economics - This paper contains 20 Multiple Choice Questions type questions of 1 mark each.
- This paper contains 4 Short Answer Questions type questions of 3 marks each to he answered in 60 to 80 words.
- This paper contains 6 Short Answer Questions type questions of 4 marks each to he answered in 80 to 100 words.
- This paper contains 4 Long Answer Questions type questions of 6 marks each to he answered in 100 to 150 words.
Section – A
Question 1.
Read the following Statements and choose the correct alternative: [1]
Statement – I: Census method is a way to collect primary data individually.
Statement – II: Census method is much cheaper source of data compared to secondary source of data.
In light of the given statements, choose the correct alternative from the following:
(A) Statement I is true and Statement II is false
(B) Statement I is false and Statement II is true
(C) Both Statements I and II are true
(D) Both Statements I and II are false
Answer:
Option (A) is correct
Explanation: Census method is a way to collect information about every unit of the universe individually and this method is more expensive than the other methods of collecting information.
Question 2.
Statistics is concerned with:
(A) Aggregates of organised facts
(B) Aggregates of disorganized facts
(C) Aggregates of purposeless facts
(D) Aggregates of unrelated facts
Answer:
Option (A) is correct
Explanation: A single numerical fact cannot be called statistics, even though the fact is numerically expressed and affected by multiplicity of causes, etc. No conclusion can be drawn from a single numerical fact. If this numerical fact is not placed in relation to any other numerical fact, it is not statistics. Statistics should be aggregate of facts and not one fact only as these facts can be compared and conclusions can be drawn from them.
Question 3.
High degree of correlation exists when two values of coefficient of correlation is between ……………… and ……………. .
(A) 0 and 0.25
(B) 0.25 and 0.5
(C) 0.5 and 0.75
(D) 0.75 and 1
Answer:
Option (D) is correct
Explanation: When correlation coefficient (r) is between+0.75 and+1, there exists high degree of positive correlation and when it is between -0.75 to -1 there exists high degree of negative correlation.
![]()
Question 4.
Identify the correct pair of terms with their definition from the following Columns I and II:
| Column I | Column II |
| A. Middle item | 1. Mean |
| B. Highest frequency | 2. Mode |
| C. Effected by extreme items | 3. Median |
| D. Calculated by grouping | 4. Combined Mean |
(A) A – 1
(B) B – 2
(C) C – 3
(D) D – 4
Answer:
Option (B) is correct
Explanation: The highest or heaviest frequency of the entire series is termed as mode value of the series.
Question 5.
Identify the following diagram and choose the correct alternative. [1]
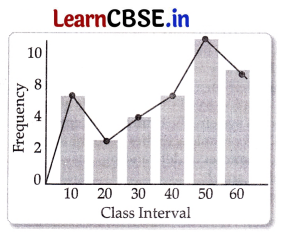
(A) Frequency polygon with histogram
(B) Frequency polygon
(C) Ogive
(D) Histogram
Answer:
Option (A) is correct
Explanation: The given diagram is a frequency polygon with histogram. In the given diagram, a polygon connects the mid-points on the tops of the rectangles in the histogram.
Question 6.
A series of statistical data showing the frequency of only one variable is called ……………. . [1]
(A) Univariate Frequency Distribution
(B) Bivariate Frequency Distribution
(C) Natural Frequency Distribution
(D) None of these
Answer:
Option (A) is correct
Explanation: It is called Univariate Frequency Distribution. Actually, the frequency distribution of single variable is called Univariate Frequency Distribution.
Question 7.
The essential condition for construction of histogram is: [1]
(A) Individual series
(B) Discrete series
(C) Continuous series
(D) None of the these
Answer:
Option (C) is correct
Explanation: For the construction of the histogram, a class interval is needed and the class interval needs to be continuous.
Question 8.
Identify the characteristics of Index Numbers and choose the correct alternatives: [1]
I. Expressed in numbers
II. Absolute Measure
III. Average of percentage
IV. Helpful in fixation of salary and allowances
Altematives:-
(A) I and II
(B) II and III
(C) I, II and III
(D) I, III and IV
Answer:
Option (D) is correct
Explanation: Index Number is the technique of measuring relative changes in the magnitude of variable. It is a relative measure which can expressed in numbers. It is average of percentage that’s why it is helpful in fixation of salary and allowances.
Question 9.
Read the following Assertion (A) and Reason (R) and choose the correct alternatives: [1]
Assertion (A): Index number and mean are one and the same thing.
Reason (R): Mean is the central value of the items present in the series.
Alternatives:
(A) Both Assertion (A) and Reason (R) are true, and Reason (R) is the correct explanation of Assertion (A).
(B) Both Assertion (A) and Reason (R) are true, but Reason (R) is not the correct explanation of Assertion (A).
(C) Assertion (A) is true, but Reason (R) is false.
(D) Assertion (A) is false, but Reason (R) is true.
Answer:
Option is correct
Explanation: Index Number is the change in the value with respect to the base year, while mean is the central value of the given data.
Question 10.
Which of the following statements is true: [1]
(A) ‘Loss of information’ is a major drawback of the classified data.
(B) Classified data does not save our time.
(C) Histogram and column diagram are the same method of presentation of data.
(D) Median of a frequency distribution cannot be known from the ogives.
Answer:
Option (A) is correct
Explanation: The classification or grouping of raw data into classes makes it more concise and understandable. But simultaneously there exists loss of information. The calculations involved in the classified data or the continuous series are based on the class midpoints. The items in such series cannot be exactly measured and consequently, an individual observation loses its importance during the statistical calculations.
![]()
Question 11.
“Classified data is better than raw data?” [3]
Do you agree with the given statement? Give valid reason in support of your answer.
Answer:
Yes, I agree with this statement.
Classified data has following advantages over raw data:
- Comprehensive: Raw data are large and entangled, whereas classified data are comprehensive and easily manageable.
- Quick Information: It is troublesome to pick up information from unclassified data. Information can be easily collected from classified data.
- Conclusions: Classification facilitates comparisons and helps in drawing fast conclusions or inferences.
- Saves Time and Energy: Classified data not only save our time but also our energy, which would otherwise be utilised in searching from entire lot of things.
Question 12.
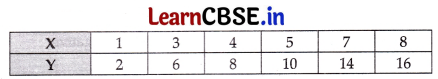
Calculate the correlation coefficient between X and Y and comment on their relationship: [3]
OR
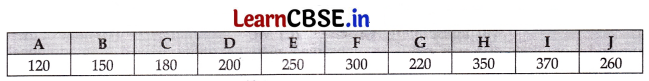
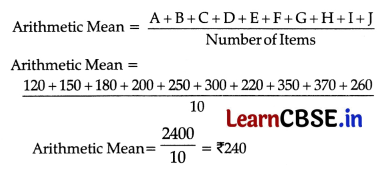
The following table gives the daily income of ten workers in a factory. Find the arithmetic mean.
Answer:
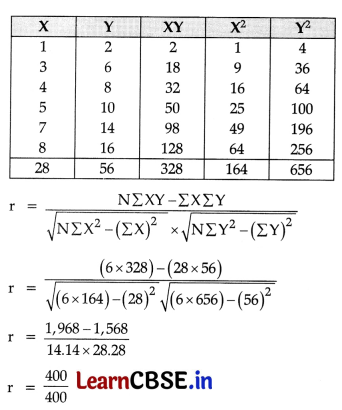
r = 1
There is perfect positive correlation.
OR
Question 13.
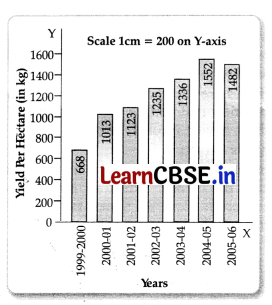
Rice yield per hectare is given below. Show the data diagrammatically. [4]
| Year | Yield per hectare (in kg) |
| 1999 – 2000 | 668 |
| 2000 – 01 | 1013 |
| 2001 – 02 | 1123 |
| 2002 – 03 | 1235 |
| 2003 – 04 | 1336 |
| 2004 – 05 | 1552 |
| 2005 – 06 | 1482 |
Answer:
The above data can be presented with the help of a simple bar diagram, since only one variable is to be presented. The figure is drawn below:
Question 14.
Find out the median for the data given below: [4]
| Class | Frequency |
| 0 – 10 | 10 |
| 10 – 20 | 5 |
| 20 – 30 | 5 |
| 30 – 40 | 11 |
| 40 – 50 | 14 |
| 50 – 60 | 5 |
| 60 – 70 | 10 |
Can the CPI number for urban non-manual employees represent the changes in the cost of living of the President of India?
Answer:
| Class | Frequency | C.F |
| 0 – 10 | 10 | 10 |
| 10 – 20 | 5 | 15 |
| 20 – 30 | 5 | 20 |
| 30 – 40 | 11 | 31 |
| 40 – 50 | 14 | 45 |
| 50 – 60 | 5 | 50 |
| 60 – 70 | 10 | 60 |
| N = 60 |
Median = Size of \(\frac{N}{2}\) th item
= Size of \(\frac{60}{2}\) th item
= Size of 30th item
which lies in 30 – 40 group
Thus, Median Value = L1 + \(\frac{\frac{N}{2}-\mathrm{Cf}}{\mathrm{f}}\) × i
= 30 + \(\frac{30-20}{11}\) × 10
=30 + 9
= 39
OR
The CPI for the urban non-manual employees cannot represent the changes in the cost of living of the President of India, This is because the consumption basket of the non-manual employees consists of different items than those of the consumption basket of President of India. In fact, in India CPI for industrial workers is the most popular index. This is used by the government to regulate Dearness Allowance (D.A.) to compensate its employees against the price rise. Hence, the CPI for the industrial workers cannot represent the changes in the cost of living of the President of India.
![]()
Question 15.
Write four uses of Consumer Price Index. [4]
Answer:
Utility/Uses of Index Numbers:
- Index Numbers make easy the difficult facts: Index Numbers presents the complex facts into simple and understandable form. So many times index number measures such changes which may not be measured directly.
- Index numbers make comparative study easy: Index Numbers show the facts represented in different units comparatively.
- Helpful in measuring irregular changes: For example changes in prices are helpful in different circumstances.
- Index Numbers studies the changes in general price level: Most important use of index number is that it measures the value of money during different periods of time.
Question 16.
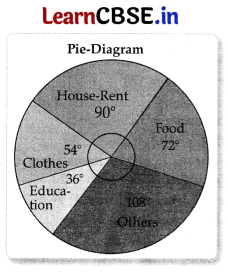
(a) Represent the following data by a pie diagram. [3]
| Items | Expenditure in ₹ |
| Food | 180 |
| House Rent | 225 |
| Clothes | 135 |
| Education | 90 |
| Other | 270 |
(b) Record only the expenditure quantities bought and prices paid per unit of the daily purchase of your family for two weeks. How has the price change affected the family? [3]
OR
(a) Define Statistics and discuss its limitations? [3]
(b) The consumer price index for June 2005 was 125. The food index was 120 and that of other items 135. What is the percentage of the total weight given to food?
Answer:
% Degree Table
| Items | Expenditure in (₹) | Expenditure in Percentage | Expenditure in Degree |
| Food | 180 | 20 | 72° |
| House Rent | 225 | 25 | 90° |
| Clothes | 135 | 15 | 54° |
| Education | 90 | 10 | 36° |
| Other | 270 | 30 | 108° |
| Total | 900 | 100 | 360° |
(b) The students are advised that they should enquire their parents about the daily expenditure. Quantities bought and prices paid per unit of daily purchases of their family for two weeks. They will come to know that the rising prices of goods have effected that family very much.
OR
(a) The word statistics is used both in plural as well as in singular sense. In plural sense, statistics means numeric facts which can be used to draw conclusions and in singular sense, it means the statistical methods with the help of which statistical information is used to treat and draw conclusions from them.
Following are the limitations of statistics:
Sometimes, when data are not properly collected then there is likelihood to draw wrong conclusions. Therefore, it is necessary to know the limitations of statistics.
- Statistics does not study about individuals: Statistics are expressed in facts. It does not study individuals. For example, there are five students in a class. Statistics only tells the average marks obtained in class, not how many marks are obtained by every student in the class.
- It does not study the qualitative aspect of problem: The most important condition of statistical study is that subject of investigation and inquiry should be capable of being qualitatively measured. For example, honesty, poverty, etc.
- Statistics can be misused: The result obtained can be manipulated accordingly to one’s own interest and such manipulated results can mislead the community.
- Statistical results lack mathematical accuracy: The results drawn from statistical analysis are normally in approximates. As the statistical analysis is based on observation of mass data, number of inaccuracies may be present and it is difficult to rectify them.
- Uniformity and homogeneity of data: It is essential that data must have the quality of uniformity and homogeneity. Heterogeneous data are not comparable. For example, it would be meaningless to compare the heights of men with heights of trees because these figures are of heterogeneous character. (Any three)
(b) Consumer Price Index = 125
Food index = 120
Deviation of food index from the consumer price index = 125 – 120 = 5
Index of other items = 135
Deviation of other items from the consumer price index = 135 – 125 = 10
Weight assigned to food = 5 /5 + 10 × 100 = 33.33%
Question 17.
(a) Does the lottery method always give you a random sample? Explain. [3]
(b) Give two examples each of sample, population and variable. [3]
Answer:
(a) Yes, the lottery method always gives a random sample’s outcome. In a random sample, each individual unit has an equal chance of getting selected. Similarly, in a lottery method, each indivi lal unit is selected at random from the population and thereby has equal opportunity of getting selected. For example, in order to select a student as monitor, the slips containing the names of all the students are mixed well, and then a slip is drawn out at random. In this case, all students of the class have equal chance of getting selected. The probability of a student getting selected through the lottery method is exactly same as the probability of any one student randomly selected.
(b) Sample is the subset of the population. In other words, a small set selected from the population for statistical study is referred as sample population. For example, in order to study the growth pattern of students, the heights of 50 students (sample) are recorded from a school of 500 students (population). Similarly, in order to record the level of sugar in the blood, blood sample of 2000 people (sample) was taken from 20,000 people (population).
Population refers to the aggregate or the total items to be studied for an investigation. In the above examples, 500 students and 20,000 people constitute the population.
Variables are the characteristics of a sample or population that can be expressed in numbers such as, height, income, age, etc.
![]()
Section – B
Question 18.
Identify the incorrect pair of items from the following Columns I and II:
| Column I | Column II |
| A. Increasing stage of Production | 1. MP increase at an increasing rate. |
| B. Constant Stage of Production | 2. TP is decreasing till it becomes zero. |
| C. Diminishing Stage of Production | 3. MP decreases. |
| D. Negative Stage of Production | 4. MP becomes negative. |
Alternatives:
(A) A – 1
(B) B – 2
(C) C – 3
(D) D – 4
Answer:
Option (B) is correct
Explanation: According to the law of variable proportion production function, during second phase of production in short run, MP starts decreasing and TP increases only at the decreasing rate. This phase is known as constant or diminishing stage of production.
Question 19.
When we add a utility derived from the consumption of all the units of the commodities, we get: [1]
(A) TU
(B) Initial utility
(C) MU
(D) none of these
Answer:
Option (A) is correct.
Explanation: Total Utility is the utility derived from the total consumption of a commodity. Marginal Utility is the utility derived from the consumption of one extra unit of a commodity.
Question 20.
As more and more units of a commodity are consumed, marginal utility derived from additional unit must decline. Write the name of the law stated earlier. [1]
(A) Law of Equi-Marginal Utility
(B) Law of Diminishing Marginal Utility
(C) Law of Demand
(D) Law of Supply
Answer:
Option (B) is correct.
Explanation: Law of diminishing marginal utility states that as more and more units of a commodity are consumed, marginal utility derived from every additional unit must decline.
Question 21.
Study the following curve and answer the given question: [1]
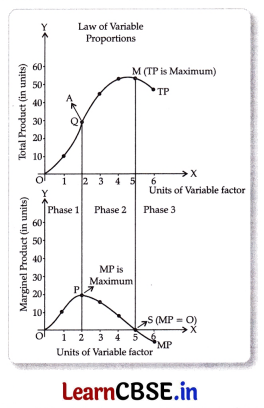
Identify the point A in above curve?
(A) Point of Inflexion
(B) Point of Equilibrium
(C) Point of Integration
(D) Point of Stagnation
Answer:
Option (A) is correct.
Explanation: Point A in above curve expressed the point of inflextion where the total product stops increasing at an increasing rate and starts increasing at the diminishing rate.
Question 22.
Read the statements Assertion (A) and Reason (R) and choose the correct alternative: [1]
Assertion (A): The demand curve slopes downward because of law of diminishing marginal utility.
Reason (R): As more of a product is consumed the marginal (additional) benefit to the consumer rises.
Alternatives:
(A) Both Assertion (A) and Reason (R) are correct, and Reason (R) is the correct explanation of Assertion (A).
(B) Both Assertion (A) and Reason (R) are correct, but Reason (R) is not the correct explanation of Assertion (A).
(C) Assertion (A) is true but Reason (R) is false.
(D) Assertion (A) is false but Reason (R) is true.
Answer:
Option (C) is correct.
Explanation: As more of a product is consumed, the marginal benefit to the consumer decreases.
Question 23.
In the long period, the supply for a commodity is: [1]
(A) Perfectly inelastic
(B) Less elastic
(C) Highly elastic
Answer:
Option (C) is correct.
Explanation: In the long period, the supply for a commodity is highly elastic because, in the long run, more and more factors are easily available and their input can be changed to increase production.
![]()
Question 24.
Which of the following can be identified as exceptions to the law of demand: [1]
I – Fear of shortage
II – Ignorance
III – Necessities of life
IV – Substitute goods Alternatives
(A) Only I
(B) Both I and II
(C) I, II and III
(D) All I, II, III and IV
Answer:
Option (D) is correct.
Explanation: From the given options, only substitute goods is not an exception to the law of demand.
Question 25.
Identify the two cost curves which start from the same point on the Y-axis. [1]
(A) TVC and TFC
(B) TFC and TVC
(C) TFC and TC
(D) TFC and AFC
Answer:
Option (C) is correct.
Explanation: As even at the 0 level of output, the firm incurs fixed cost but no variable cost, so at 0 level of output, the total fixed cost and the total cost will be equal making their curve start from the same point.
Question 26.
There are two statements given below, marked as Statement (I) and Statement (II). Read the statements and
choose the correct option. [1]
Statement -I: Under monopolistic competition, each firm is the sole producer of a particular brand.
Statement – II: Product differentiation creates a monopoly position for a firm.
In light of the given statements, choose the correct alternative from the following:
Alternatives
(A) Statement I is true and Statement II is false
(B) Statement I is false and Statement II is true
(C) Both statements I and II are true
(D) Both statements I and II are false
Answer:
Option (C) is correct.
Explanation: Monopolistic competition is a form of market in which there are large number of firms selling closely related but differentiated products. That’s why each firm is the sole producer of a particular brand and it creates a monopoly position for a firm.
Question 27.
Scarcity is a situation in which : [1]
(A) Demand exceeds the supply
(B) Supply exceeds the demand
(C) Both (A) and (B)
(D) None of these
Answer:
Option (A) is correct.
Explanation: Scarcity is the situation when the resources cannot meet the human needs i.e. the demand is more than the supply.
Question 28.
What will be the effect on the equilibrium price if both the demand and supply in the economy increases? [3]
OR
In a perfect competition the perfect knowledge can be of:
(i) Market
(ii) Inputs used in production.
What implications does it have?
Answer:
There are three possibilities:
- If the relative (percentage) increase in demand is greater than the increase in supply, price will rise. The price will rise because of excess demand in the market.
- If the relative (percentage) increase in demand is less than the increase in supply, price will fall. The price falls because of excess supply in market.
- If the relative (percentage) increase in demand j is equal to the increase in supply, price will remain unchanged. The price will remain unchanged because there is neither excess ‘ demand nor excess supply in the market.
OR
(i) Market: In a perfectly competitive market, the number of buyers and sellers is very large and all the buyers and sellers have perfect knowledge about the market. As a result no individual buyer or seller can influence the price in the market.
(ii) Inputs used in production: Another important characteristic of perfect competition is that products are homogeneous and carry the same price. By implication, this means the cost of the inputs used by the producers will be same. As a result of this all sellers have perfect knowledge about the inputs used in the production.
![]()
Question 29.
Why is a firm under perfect competition a ‘price-taker’ and not a ‘price-maker’? Explain. [3]
Answer:
There are large number of sellers in perfectly competitive market, so, an individual firm has a negligible share in total supply. As such no individual seller can influence the market price on its own. The seller has no option but to accept the market determined price. It makes the seller a ‘Price Taker’.
Question 30.
The price elasticity of demand of a good is (-) 0.5. At a price of ₹40 per unit its demand is 300 units. At what price
will its demand increase by 20 % ? [4]
Answer:
Elasticity of demand = \(\frac{\% \text { Change in Q.D }}{\% \text { Change in Price }}\)
= \(\frac{\Delta Q}{\Delta P} \times \frac{P}{Q}\)
Given Ed = (-) 0.5, P = ₹40, Q = 300, P1 = ?,
Q1 = 20% of 300
∴ Q1 = 300 + 60 = 360
ΔP = ?
ΔQ = 360 – 300 = 60,P = 40,Q = 300
Thus, Ed = \(\frac{\Delta Q}{\Delta P} \times \frac{P}{Q}\)
or – (0.5) × 300 ΔP = 2,400
or – 150 ΔP = 2,400
∴ ΔP = – \(\)\frac{2400}{150}\(\)
= (-) 16
NewPrice = ΔP + P = – (16) + 40 = ₹24
Question 31.
Complete the following table: [4]
| Output (Units) | Average Cost (₹) | Marginal Cost (₹) |
| 1 | 12 | – |
| 2 | 10 | – |
| 3 | – | 10 |
| 4 | 10.5 | – |
| 5 | 11 | – |
| 6 | – | 17 |
OR
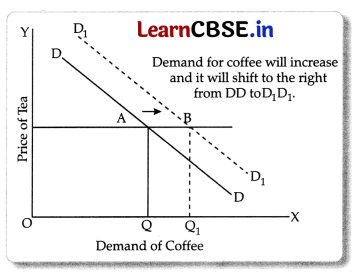
A and B are substitute goods. Explain the effect of rise in price of A on the demand for B.
Answer:
| Output (Units) | Average Cost (AC) (₹) | Total Cost (TC) (₹) | Marginal Cost (MC) (₹) |
| 1 | 12 | 12 | 12 |
| 2 | 10 | 20 | 8 |
| 3 | 10 | 30 | 10 |
| 4 | 10.5 | 42 | 12 |
| 5 | 11 | 55 | 13 |
| 6 | 12 | 72 | 17 |
OR
In case of substitute goods, increase in the price of one good causes an increase in the demand of its substitute goods, for example, Tea and Coffee are substitute goods. When the price of tea increases, it will lead to increase in the demand of coffee, as the consumers will now start consuming more of coffee in place of tea.
Question 32.
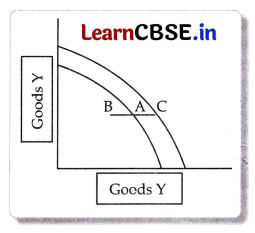
There are three points A, B and C on PPC curve, representing three different situations of resources. Identify the situation and discuss. [4]
Answer:
Given PPC showing the following situations:
- Full employment of resources.
- Underemployment of resources.
- Growth of resources.
In the figure point A indicates full employment of resources. It is on P1P1 the initial Production Possibility Curve. Point B indicates underemployment of resources. It is below PPC (P1P1). Point C (on a higher PPC) shows growth of resources.
Question 33.
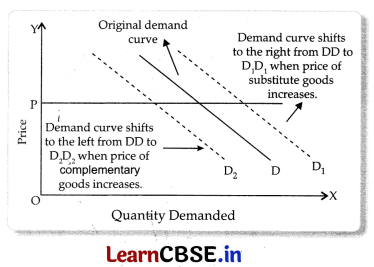
(a) “Demand for a good is affected by the rise in prices of related goods.
Justify the statement, giving reasons in support of your answer. [3]
(b) Explain any two factors that affect the price elasticity of demand. Give suitable examples. [3]
OR
(a) Why is the equality between marginal cost and marginal revenue necessary for a firm to be in equilibrium? Is
it sufficient to ensure equilibrium? Explain. [3]
(b) State whether the following statements are true or false. Give reasons for your answer:
(i) Under diminishing returns to a factor, marginal product and total product both increase at a ‘ diminishing rate.
(ii) When marginal cost rises, average cost also rises.
(iii) Marginal Revenue can never be negative.
Answer:
(a) Related goods are of two types : Substitute goods and Complementary goods.
- In case of substitute goods : Increase in the price of one good results in increase in the demand of its substitute good. Example: – Tea and Coffee. When, the price of tea increases, then the consumers will start consuming more of coffee in place of tea. As a result, demand of coffee increases.
- In case of complementary goods: When price of one commodity increases demand for its complementary goods falls. For example: increase in price of petrol will decrease the demand for car. Following diagram shows this:
(b) Factors affecting elasticity of demand are as follows:
(i) Availability of Close Substitutes: A commodity will have elastic demand if there are goods substitutes available. For example:- Pepsi, Coca-Cola, Frooti. A commodity having no substitutes, for example salt, will have inelastic demand.
(ii) Postponement of Use: Usually the demand for such commodities whose use can be postponed for some time is elastic. For example : the demand for DVD player is elastic because its use can be postponed for some time, if its price goes up, but the demand for wheat and rice is inelastic because their use cannot be postponed even when price goes up.
OR
(a) According to this approach, the producer is at equilibrium, when the Marginal Revenue (MR) is equal to the Marginal Cost (MC) and marginal cost curve cuts the marginal revenue curve from below. Two conditions under this approach are:
(i) MR = MC
(ii) MC curve should cut the MR curve from below, or MC should be rising.
MR is the addition to total revenue from the sale of one more unit of output and MC is the addition to total cost for increasing the production by one unit. The basic aim of every producer is to maximise the profit. For this, a firm compares its MR with its MC.
(b) (i) False, because when MP falls, TP increases at a diminishing rate only upto a point, then starts falling.
(ii) False, because AC rises only when MC is greater than AC.
(iii) False, because when a firm can sell more only by lowering the price it is possible that marginal revenue becomes negative after a level of output.
![]()
Question 34.
Read the passage given below and answer the questions that are followed. [3]
A perfectly competitive market has been defined as one where an individual firm is unable to influence the price at which the product is sold in the market. Since price remains the same for any level of output of the individual firm, such a firm is able to sell any quantity that it wishes to sell at the given market price. It, therefore, does not need to compete with other firms to obtain a market for its produce. This is clearly opposite of the meaning of what is commonly understood by competition or competitive behaviour. We see that Coke and Pepsi compete with each other in a variety of ways to achieve a higher level of sales or a greater share of the market. Conversely, we do not find individual farmers competing among themselves to sell a larger amount of crop. This is because both Coke and Pepsi possess the power to influence the market price of soft drinks, while the individual farmer does not On the basis of the given text and common understanding, answer the following questions:
(a) There are large numbers of buyers in a perfectly competitive market. Explain the significance of this feature. [2]
(b) State the main features of a perfectly competitive market.
Answer:
(a) The number of buyers of commodity is very large under perfect competition. It is so large that by varying its demand, an individual buyer can not affect total market demand for a commodity. Accordingly, an individual buyer can not affect market price. He can buy any quantity at the existing price of the commodity. An individual buyer is a price taker.
(b) Main features of perfect competition:
- Large Number of Buyers and Sellers: There are so many buyers and sellers that no individual buyer or seller can influence the price of the commodity in the market.
- The Products are Homogeneous: All the firms in the perfectly competitive market sell homogeneous (identical) products. The products are perfect substitutes to one another.
- Free Entry and Exit to Firms: The industry is characterised by freedom of entry and exit of firms. Firms have freedom to move in and out of an industry.
- Buyers and Sellers have Perfect Knowledge: Firms have complete knowledge about the product market and factor market. Buyers also have perfect knowledge about the product market.