Students must start practicing the questions from CBSE Sample Papers for Class 11 Economics with Solutions Set 3 are designed as per the revised syllabus.
CBSE Sample Papers for Class 11 Economics Set 3 with Solutions
Time : 3 Hours
Maximum Marks : 80
General Instructions:
- This question paper contains two sections:
Section A – Statistics for Economics Section B – Introductory Micro Economics - This paper contains 20 Multiple Choice Questions type questions of 1 mark each.
- This paper contains 4 Short Answer Questions type questions of 3 marks each to he answered in 60 to 80 words.
- This paper contains 6 Short Answer Questions type questions of 4 marks each to he answered in 80 to 100 words.
- This paper contains 4 Long Answer Questions type questions of 6 marks each to he answered in 100 to 150 words.
Section – A
Question 1.
Read the following Assertion (A) and Reason (R) and choose the correct alternative: [1]
Assertion (A): Census Investigation method is a very costly method.
Reason (R): Census method involves surveying a large number of people and so it requires a lot of labour and manpower.
Alternative:
(A) Both Assertion (A) and Reason (R) are true, and Reason (R) is the correct explanation of Assertion (A)
(B) Both Assertion (A) and Reason (R) are true, but Reason (R) is not the correct explanation of Assertion (A).
(C) Assertion (A) is true, but Reason (R) is false.
(D) Assertion (A) is false, but Reason (R) is true.
Answer:
Option (A) is correct
Expin nation: As census method involves surveying a large number of people requiring a lot of manpower, it is a very expensive method.
Question 2.
Which of the following is true regarding’Questionnaire’: [1]
(A) It is economical in terms of time, cost and manpower.
(B) It is an important secondary data source.
(C) Information can be collected through government records.
(D) NSSO use this method to estimate population in India
Answer:
Option (A) is correct
Explanation: ‘Questionnaire’ is primary data source in which information is gained through questionnaire. It is economical in terms of time, cost and’manpower.
Question 3.
Which of the following is known as positional average of series: [1]
(A) Mean
(B) Index Number
(C) Median
(D) Mode
Answer:
Option (C) is correct
Explanation: Median divide series into two equal parts, that’s why it is also known as positional average.
![]()
Question 4.
There are two statements given below, marked as Statement (I) and Statement (II). Read the statements and
choose the correct option: [1]
Statement – I Sample Method is better than the Census Method for gathering information.
Statement – II Sample method saves time as well as the energy of the investigator.
(A) Only I is true
(B) Only II is true
(C) Both I & II are trues
(D) Both I & II are false.
Answer:
Option (C) is correct
Explanation: Both Sample and Census Method are methods for collection of data but Census Method is more expensive and is time taking process while sample method is economical as well as time saving process.
Question 5.
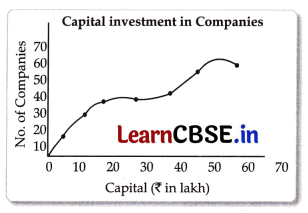
Frequency distribution analysis of capital investment in top companies are presented the following diagram:
Identify the type of following diagram. [1]
(A) Less than ogive
(B) More than Ogive
(C) Pie chart
(D) Histogram
Answer:
Option (A) is correct
Explanation: The given diagram is a less than ogive presenting frequency distribution of companies. It is a graph that contains a set of points that start from the origin.
Question 6.
Mode is not affected by the ………………. values. [1]
(A) Extreme
(B) Central Value
(C) First Value
(D) Last Value
Answer:
Option (A) is correct
Explanation: Mode is sensitive only to the most frequently occuring score, it is insensitive to all other scores.
Question 7.
Identify the correctly matched items from Column I to that of Column II:
| Column I | Column II |
| A. This table presents more than one characteristic of the data. | 1. Complex Table |
| B. This table presents only one characteristic of the data. | 2. Multidimensional Table |
| C. This table shows the nature of the data collected. | 3. Two-way Table |
| D. This table shows the data derived from another table. | 4. Original Table |
(A) A – 1
(B) B – 2
(C) C – 3
(D) D – 4
Answer:
Option (A) is correct.
Question 8.
“It is necessary to convert the percentage into angles of different degrees.” [1]
Which of the following diagram is associated with the above statement:
(A) Pie diagram
(B) Histogram
(C) Polygon
(D) Ogive
Answer:
Option (A) is correct
Explanation: Pie diagram is a circular representation of data, that’s why it is necessary to convert the percentage into angles of different degrees.
![]()
Question 9.
There are two statements given below, marked as Statement (I) and Statement (II). Read the statements and
choose the correct option: [1]
Statement (I) – Only mixed economy adopt the method of planning for economic development.
Statement (II) – Statistics is widely used in modern times.
(A) Statement I is true and statement II is false
(B) Statement I is false and statement II is true
(C) Both statements I and II are true
(D) Both statements I and II are false
Answer:
Option (B) is correct
Explanation: Statistics is the most important tool in economic planning and it is widely used in modern times. Most of the countries of the world adopt the method of planning for economic development.
Question 10.
Which of the following statements is true: [1]
(A) Mean value should be negative.
(B) The degree of correlation lies between 0 to 1
(C) Scattered diagram is used for measuring median value.
(D) Mode is item that occurs the highest number of times.
Answer:
Option (D) is correct.
Explanation: Highest or heaviest item of a series is known as mode value of the series
Question 11.
“Statistics is the most dangerous tool in the hands of an unskilled person”. [3]
Do you agree with the given statement? Give valid reason in support of your answer.
Answer:
Yes, I agree with this statement. Statistics is both science and art. That’s why it can’t be used by raw hands. This will give rise to distrust, misleading result, lies, distorted picture of the facts; because those who do not have special knowledge of statistical methods can’t make sensible use of statistics, thus leading to dangerous consequences.
Question 12.
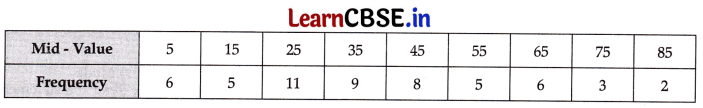
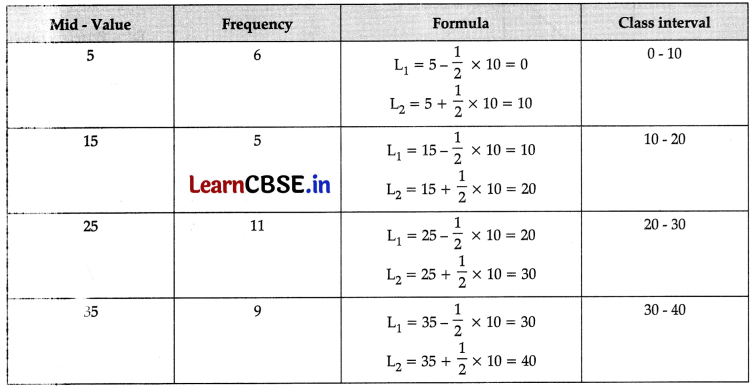
Convert the following mid-value series into series with class interval [3]
OR
Discuss any three properties of Arithmetic Mean.
Answer:
OR
Arithmetic Mean is the most commonly used measure of central tendency.
The most common properties of Arithmetic Mean are following:
- Arithmetic Mean is located between the extreme values.
- The sum of deviations of the observations from their arithmetic mean is always zero.
- The sum of the squares of the deviations of the items from their Arithmetic Mean is minimum which is less than the sum of squared deviations of the items from any other values.
Question 13.
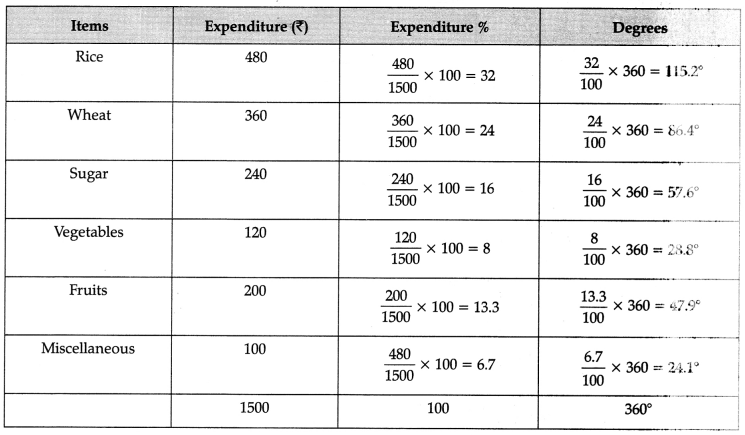
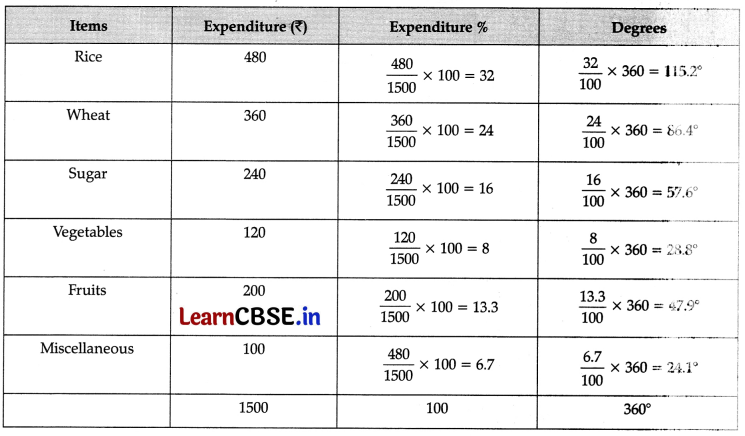
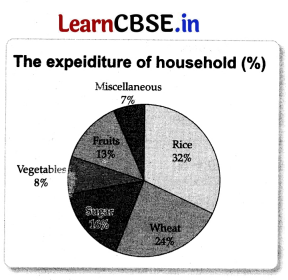
Construct a pie-diagram to represent the daily consumption on consumer goods: [4]
| Items | Expenditure (₹) |
| Rice | 480 |
| Wheat | 360 |
| Sugar | 240 |
| Vegetables | 120 |
| Fruits | 150 |
| Miscellaneous | 100 |
OR
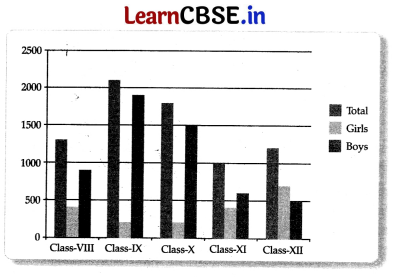
The following table represents the age group statistics of students in government school of Delhi. Prepare a suitable diagram to represent the given data: [4]
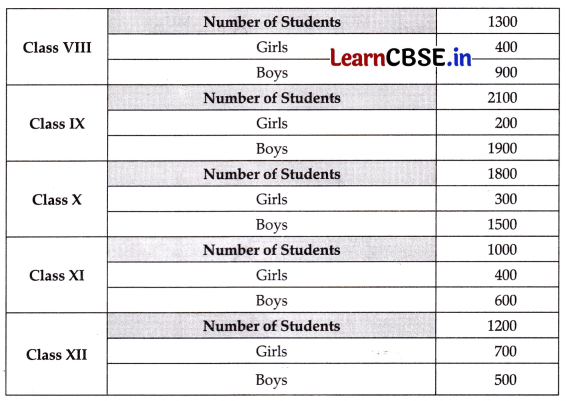
Answer:
The Multiple bar diagram of given data is shown below:
![]()
Question 14.
The mean marks in statistics of 200 students in a public school of Delhi was 50. Unfortunately the marks of two
students were taken as 85 and 25 instead of and 58 and 32. Find the correct mean. [4]
Answer:
Formula for Mean value is = \(\frac{\Sigma X}{N}\)
ΣX = Number of Students × Mean Value
= 200 × 50
= 10,000
Correct Mean = \(\frac{\sum X(\text { Total Marks })-\text { Wrong marks }+ \text { Correct Marks }}{\text { Number of Students }}\)
= \(\frac{10,000-(85+25)+(58+32)}{200}\)
= \(\frac{9,980}{200}\)
Correct Mean = 49.9
Question 15.
‘The degree of closeness of scatter points and their overall direction gives us an idea of the nature of the relationship
between variables.’ Explain. [4]
Answer:
Scatter diagram is a graphic method of studying correlation. To construct a scatter diagram, X variable is taken on X-axis and Y variable is taken on Y-axis. The cluster of points, so plotted is referred to as a scatter diagram. In a scatter diagram, the degree of closeness of scatter points and their overall direction gives us an idea of the nature of the relationship.
- If the dots move from left to right wards, correlation is said to be positive whereas the movement of dots from left to right downwards indicates negative correlation.
- Dots in a straight line indicate perfect correlation.
- Dots falling close to each other in a straight line indicate high degree of correlation.
Question 16.
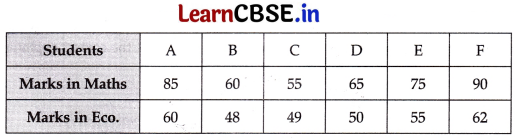
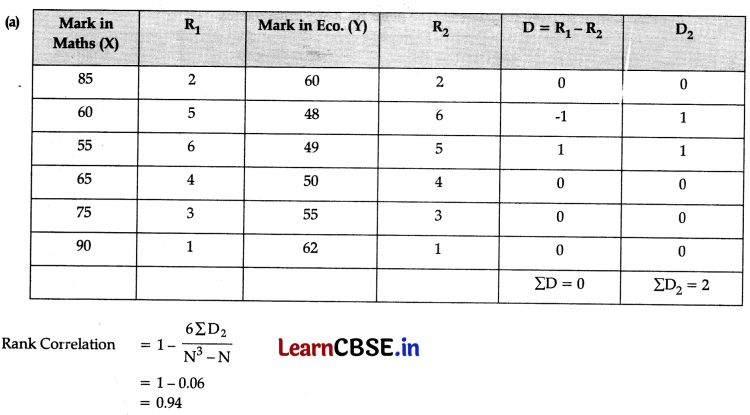
(a) Marks obtained in Maths and Economics obtained by six students are given below. Calculate Rank Co-efficient of correlation. [3]
(b) Does the lottery method always give you a random sample? Explain. [3]
OR
(a) Give the meaning of producer’s equilibrium. A producer produces that quantity of his product at which
marginal cost and marginal revenue are equal. Is he earning maximum profit? Give reasons for your answer. [3]
(b) Explain any two causes of “Decrease” in supply of a commodity. [3]
Answer:
(b) Yes, the lottery method always gives a random sample’s outcome. In a random sample, each individual unit has an equal chance of getting selected. Similarly, in a lottery method, each individual unit is selected at random from the population and thereby has equal opportunity of getting selected. For example, in order to select a student as monitor, the slips containing the names of all the students are mixed well, and then a slip is drawn out at random. In this case, all students of the class have equal chance of getting selected. The probability of a student getting selected through the lottery method is exactly same as the probability of any one student randomly selected.
OR
(a) Producer’s Equilibrium: A producer (firm) is said to be in equilibrium when the firm is producing that quantity of output which gives the firm maximum profit. For a firm, to be in equilibrium, two conditions must be fulfilled. First, and the necessary condition is that firm’s marginal cost equals marginal revenue. Second, along with the first condition is that MC must be greater than MR beyond the level of output at which MC = MR. Therefore, fulfilment of the first condition alone does not ensure maximum profits. It is possible that MC = MR condition may be fulfilled at more than one output level but only that output level beyond which MC > MR is the maximum profit output level.
(b) Two causes of decrease in supply are :
- Imposition of Unit Tax : It raises cost. Price remaining unchanged, profits fall. This leads to ‘decrease’ in supply.
- Rise in Prices of Inputs : It raises cost. Price remaining unchanged, profits fall. This leads to ‘decrease’ in supply.
![]()
Question 17.
(a) Calculate median value from the following data: [3]
| Size | Cumulative Frequency |
| 0 – 5 | 1 |
| 5 – 10 | 3 |
| 10 – 15 | 7 |
| 15 – 20 | 8 |
| 20 – 25 | 10 |
(b) Define Mode and write its three demerits.
Answer:
(a)
| Size | Frequency | C.F |
| 0 – 5 | 1 | 1 |
| 5 – 10 | 2 | 3 |
| 10 – 15 | 4 | 7 |
| 15 – 20 | 1 | 8 |
| 20 – 25 | 2 | 10 |
| Σf = 10 |
Median Value = Size of \(\frac{N}{2}\) th item of the series
= Size of th \(\frac{10}{2}\) th item of the series
= Size of 5th item of the series
Thus 5th item lies with 10 – 15 class intervals
Median Value = \(\mathrm{L}_1+\frac{\frac{\mathrm{N}}{2}-\mathrm{CF}}{\mathrm{F}} \times \mathrm{i}\)
= 10 + \(\frac{5-3}{4}\) × 5
= 10 + 2.5
= 12.5
(b) Mode: “The value occurring most frequently in series (or group) of items and around which the other items are distributed most densely”.
Demerits of the Mode
- Incapable of algebraic treatment: Unlike mean, mode is not capable of further algebraic treatment.
- Uncertain and vague: Mode is an uncertain and vague measure of central tendency.
- Restricted use: If the frequency of each item of the series is same than mode cannot be calculated. In this way, the use of mode is restricted.
Section – B
Question 18.
Which of the following statement is true: [1]
(A) Stock refers to the total quantity of a commodity available with the seller at any given time.
(B) Stock refers to the total quantity of a commodity available with the buyer at any given time.
(C) Stock refers to the total price available with the seller at any given time.
(D) Stock refers to the total cash of a commodity available with the seller at any given time.
Answer:
Option (A) is correct
Question 19.
“The consumer is said to be in equilibrium when he maximize his level of satisfaction after the consumption of
goods with spending a certain amount of money. [1]
Which of the following algebraic concept justify the above statement:
(A) MUm = \(\frac{\mathrm{MUx}}{\mathrm{Px}}\)
(B) MUx = \(\frac{\mathrm{MU}_{\mathrm{m}}}{\mathrm{Px}}\)
(C) Px = \(\frac{\mathrm{MU}_{\mathrm{m}}}{\mathrm{MUx}}\)
(D) All of these
Answer:
Option (A) is correct.
Explanation: The consumer is said to be in equilibrium when marginal utility of money is equal to marginal utility of commodity in one commodity case. The algebraic concept of consumer’s equilibrium is MUm = \(\frac{\mathrm{MUx}}{\mathrm{Px}}\)
Question 20.
Which of the following is true regarding indifference curve: [1]
(A) It is convex to the origin.
(B) It never intersects.
(C) Higher indifference curve represent lower level of satisfaction.
(D) It always slopes downwards.
Answer:
Option (C) is correct.
Explanation: Higher indifference curve represent lower level of satisfaction because an indifference curve represents those combinations which yield a higher level of satisfaction.
Question 21.
Study the following curve and answer the given question: [1]
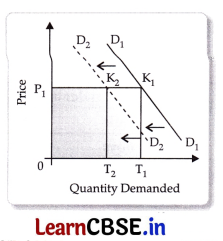
The above curve is associated with which of the following situation:
(A) Increase in price of complementary goods
(B) Decrease in price of complementary goods
(C) Increase in price of substitute goods
(D) Increase in price of normal goods
Answer:
Option (B) is correct.
Explanation: Given curve is associated with decrease in price of complementary goods because if price of complementary goods rises the demand for a commodity also falls and vice versa.
Question 22.
Read the statements Assertion (A) and Reason (R) and choose the correct alternative: [1]
Assertion (A): Demand for antiques is perfectly inelastic.
Reason (R): The perfectly inelastic demand has the elasticity equal to zero.
Alternatives:
(A) Both Assertion (A) and Reason (R) are correct, and Reason (R) is the correct explanation of Assertion (A).
(B) Both Assertion (A) and Reason (R) are correct, but Reason (R) is not the correct explanation of Assertion (A).
(C) Assertion (A) is true but Reason (R) is false.
(D) Assertion (A) is false but Reason (R) is true.
Answer:
Option (A) is correct.
Explanation: Demand for antiques is perfectly inelastic as the demand for the antiques will not be affected by the change in the price levels.
![]()
Question 23.
Average Production (AP) in short run can have ……………… . [1]
(A) Positive values only
(B) Negative values only
(C) Both positive and negative values
(D) Neither positive nor negative values
Answer:
Option (A) is correct.
Explanation: As Average Product is found by dividing the total product by the number of output, it can never be negative.
Question 24.
There are two statements given below, marked as Statement (I) and Statement (II). Read the statements and
choose the correct option: [1]
Statement – I : Law of diminishing marginal utility state the relation between price and quantity demand of a commodity.
Statement – II : The consumer will buy more units only when the price falls.
Alternatives
(A) Statement I is true and Statement II is false
(B) Statement I is false and Statement II is true
(C) Both statements I and II are true
(D) Both statements I and II are false
Answer:
Option (B) is correct.
Explanation: According to the Law of Diminishing Marginal Utility, as we consume more and more units of a commodity, the utility derived from each successive unit goes on decreasing. Law of demand states that, there is inverse relationship between quantity demanded and price of commodity. So, consumer will buy more units only when the price falls.
Question 25.
If price elasticity of supply is 2, it means that 10% fall in price leads to …………….. fall in supply. [1]
(A) 10%
(B) 20%
(C) 5%
(D) None of the these
Answer:
Option (B) is correct.
Explanation: If price elasticity of supply is 2, it means 20% change in quantity supply take place after the change of 10% in price of the commodity.
Question 26.
There are two statements given below, marked as Statement (I) and Statement (II). Read the statements and
choose the correct option: [1]
Statement – I: The expenditure incurred with producer for the production is known as cost.
Statement – II: The expenditure made by a farmer for cultivation of crop is also termed as explicit cost.
Alternatives
(A) Statement 1 is true and Statement 2 is false.
(B) Statement 1 is false and Statement 2 is true.
(C) Both statements 1 and 2 are true
(D) Both statements 1 and 2 are false
Answer:
Option (A) is correct.
Explanation: Production cost or cost refers to the expenditure made by the producer. In agriculture sector the cost of production is called implicit cost.
Question 27.
From the set of the events given in column I and corresponding concern theory given in Column II, choose the
incorrect pair of statements: [1]
| Column I | Column II |
| A. Law of Variable Proportion | 1. Short Run Production |
| B. Law of Diminishing Marginal Utility | 2. Utility Approach |
| C. Law of Demand | 3. Producers Behaviour |
| D. Indifference Curve | 4. Consumer’s Behaviour |
Alternatives
(A) A – 1
(B) B – 2
(C) C – 3
(D) D – 4
Answer:
Option (C) is correct.
Explanation: Law of demand is associated with consumer’s behaviour and demand.
Question 28.
The price elasticity of demand for a good is (-) 0.4. If its price increases by 5%, by what percentage will its demand fall? Calculate. [3]
Answer:
Elasticity of demand = \(\frac{\text { \%Change in Q.D }}{\% \text { Change in Price }}\)
(-) 4 = \(\frac{\text {\%Change in Q.D }}{5}\)
Percentage change in Q.D = (-) (0.4) × 5
= (-) 2.0
∴ Demand fails by 2 percent
Question 29.
Explain the chain effects, if the prevailing market price is below the equilibrium price. [3]
Answer:
When market price is less than the equilibrium price excess demand is created, i.e., quantity demanded is more than the quantity supplied at the prevailing market price. If the prevailing market price, say OP1 is less than equilibrium price OP, then market
demand of OP1 will be greater than market supply of OP2.
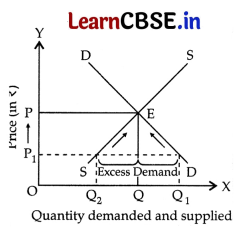
- The excess demand of Q1Q2 results in competition amongst the buyers as each buyer wants to have the commodity. It leads to increase in market price.
- Increase in price results in contraction along the demand curve and expansion along the supply curve.
- The market price will continue to rise till excess demand is wiped out.
Conclusion: Eventually price will increase to a level where market demand is equal to market supply at OQ and equilibrium price of OP will be attained.
![]()
Question 30.
Giving reasons, state whether the following statements are true or false: [4]
(a) When equilibrium price of a good is less than the market price, there will be competition among the sellers.
(b) Excess supply of a commodity exists when its market price is greater than its equilibrium price.
Answer:
(a) True
Because when the prevailing market price is higher than the equilibrium price there will be excess supply, and since the sellers will not be able to sell all they want to sell, there will be competition among sellers.
(b) True
Excess supply occurs when the market price is greater than the equilibrium price. This leads competition among sellers as a result of which price starts falling and again market price becomes equal to equilibrium price.
Question 31.
Calculate Marginal Cost at each level of output: [4]
| Output (Units) | Average Variable Cost (AVC) (₹) |
| 1 | 13 |
| 2 | 11 |
| 3 | 10 |
| 4 | 10 |
| 5 | 11 |
| 6 | 12 |
OR
What do you understand by:- [4]
(a) Positive Economic Analysis
(b) Normative Economic Analysis.
Answer:
Calculation of Marginal Cost at each level of output:
| Output(Units) | AVC | TVC | MC = ΔTVC/ΔQ |
| 1 | 13 | 13 | 13 |
| 2 | 11 | 22 | 9 |
| 3 | 10 | 30 | 8 |
| 4 | 10 | 40 | 10 |
| 5 | 11 | 55 | 15 |
| 6 | 12 | 72 | 17 |
OR
(a) Positive economics is the branch of economics that concerns the description and explanation of economic phenomena. It focuses on facts and cause and effect behavioural relationships and includes the development and testing of economic theories. Positive economics is objective and fact based. For example, the statement, “government-provided healthcare increases public expenditures” is a positive economic statement.
(b) Normative economics is a part of economics that expresses value or normative judgments about economic fairness or what the outcome of the economy or goals of public policy ought to be. Normative economics is subjective and value based. For example, the statement, “government should provide basic healthcare to all citizens” is a normative economic statement.
Question 32.
There are two diagrams given below concerned with producer’s behaviour. Identify the nature of supply in both the curves/diagrams? [4]
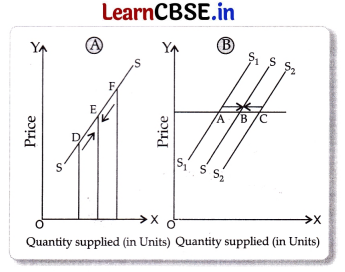
Answer:
The given diagram (A) is concerned with change in quantity supplied and diagram (B) is concerned with change is supply.
A. Change in Quantity Supplied: It refers to the change in supply due to own price of the goods only. (Refer fig. A). It means movement along the same supply curve. It is called extension when supply rises from D to E and contraction when supply falls (from F to E).
B. Change in Supply: It refers to change in supply due to factor other than the own price of the goods like change in prices of inputs, etc., (Refer fig. B). This leads to shift of supply curve. It is called increase in supply, when supply rises (from A to B) and decreases when supply falls from (C to B).
Question 33.
(a) “In a perfectly competitive market, the buyers treat products of all the firms as homogeneous.” Justify the statement with valid arguments. [3]
(b) ‘Buffer stock’ as a tool of price floor. Justify the statement with valid arguments. [3]
OR
(a) An individual is both the owner and the manager of shop taken on rent. Identify implicit cost and explicit cost
from this information. [3]
(b) Supply curve is the rising portion of marginal cost curve over and above the minimum of Average Variable
Cost Curve. Do you agree? Support your answer with valid reason. [3]
Answer:
(a) A product being perfectly homogeneous implies that all units of a commodity are identical in size, quality, shape, colour, weight, etc. In a state of perfect competition, a perfectly homogeneous product is sold in the market at a uniform price. If ever an individual firm tries to charge higher price, it would lose all its buyers to a large number of other sellers in the market. In a perfectly competitive environment, homogeneous product does not allow to enter in the market.
(b) Buffer stock is an important tool in the hands of government to ensure price floor/minimum support price. If in case, the market price is lower than what the government feels should be given to the farmers/producers it would purchase the commodity at higher price from the farmers/ producers so as to maintain stock of the commodity with itself to be released in case of shortage of the commodity in future.
OR
(a) In the given case, rent paid for a shop is explicit cost because it is the expense incurred by the producer for purchasing the inputs from market. As a manager, the owner is rendering his own services. Managerial services are not
hired from the market. So they are implicit cost as these costs are incurred on the use of self- owned inputs.
(b) Yes, we do agree with the given statement that the supply curve is the rising portion of marginal cost curve over and above the minimum of Average Variable Cost Curve, since no rational producer/seller would like to supply his output to the market. If he is unable to recover his per unit variable cost as it would lead to losses between the range of minimum of marginal cost and minimum of average variable cost.
![]()
Question 34.
Read the passage given below and answer the questions that are followed:
In a market system, all goods or services come with a price (which is mutually agreed upon by the buyers and sellers) at which the exchanges take place. The price reflects, on an average, the society’s valuation of the good or service in question. If the buyers demand more of a certain good, the price of that good will rises. This signals to the producers of that good that the society as a whole wants more of that good than is currently being produced and the producers of the good, in their turn, are likely to increase their production. In this way, prices of goods and services send important information to all the individuals across the market and help achieve coordination in a market system. Thus, in a market system, the central problems regarding how much and what to produce are solved through the coordination of economic activities brought about by the price signals.
On the basis of the given text and common understanding, answer the following questions:
(a) Why does an economic problem arise? [2]
(b) Explain the problem of ‘what to produce’ with the help of an example. Does it arise in every economy?
Explain. [4]
Answer:
(a) There are three reasons :
- Wants of people are unlimited: It is due to unending circle of wants. After the satisfaction of one want, another want arises.
- Resources are limited: Problem of allocation of resources arises because resources are not enough to satisfy wants of every individual.
- Resources have alternative uses: Scarce resources have alternative uses. When an individual chooses to use a given resource for something, he/she is unable to use that resources for anything else.
(b) Every economy faces the problem of what to produce. Because resources are scarce, we cannot produce everything in whatever quantity we wish to, we are bound to face the problems of what to produce and how much. Illustration: Let us assume that resources available are worth 5 crore. Assuming technology to be constant, we can utilise resources entirely for the production of (say) guns and produce 500 guns, or utilise these resources entirely for the production of (say) bread and produce 500 tons of bread. We need guns for the defence and bread for the masses. Accordingly, both the guns and bread are to be produced. How much of each is to be produced depends on the wisdom of the planners in a planned economy, also upon the market forces of demand and supply in a free economy.